
The short version
- Support is a price where buying has stopped falls before. Resistance is where selling has stopped rises.
- They’re zones, not exact lines. Draw them where price reacted clearly, on the daily or weekly chart.
- When a level breaks, it often flips: old resistance becomes new support, and the other way round.
- The more times a level is tested, the weaker it can get. Wait for the close before trusting a break.
Look at any chart long enough and you’ll notice something odd. Price keeps stopping at the same places, as if it bumped into an invisible floor or ceiling. It bounces off one level three times, then can’t get past another for weeks.
Those places are support and resistance, the most useful idea in charting. You don’t need any indicator to see them, and once you can, every chart starts to make more sense.
What support and resistance are
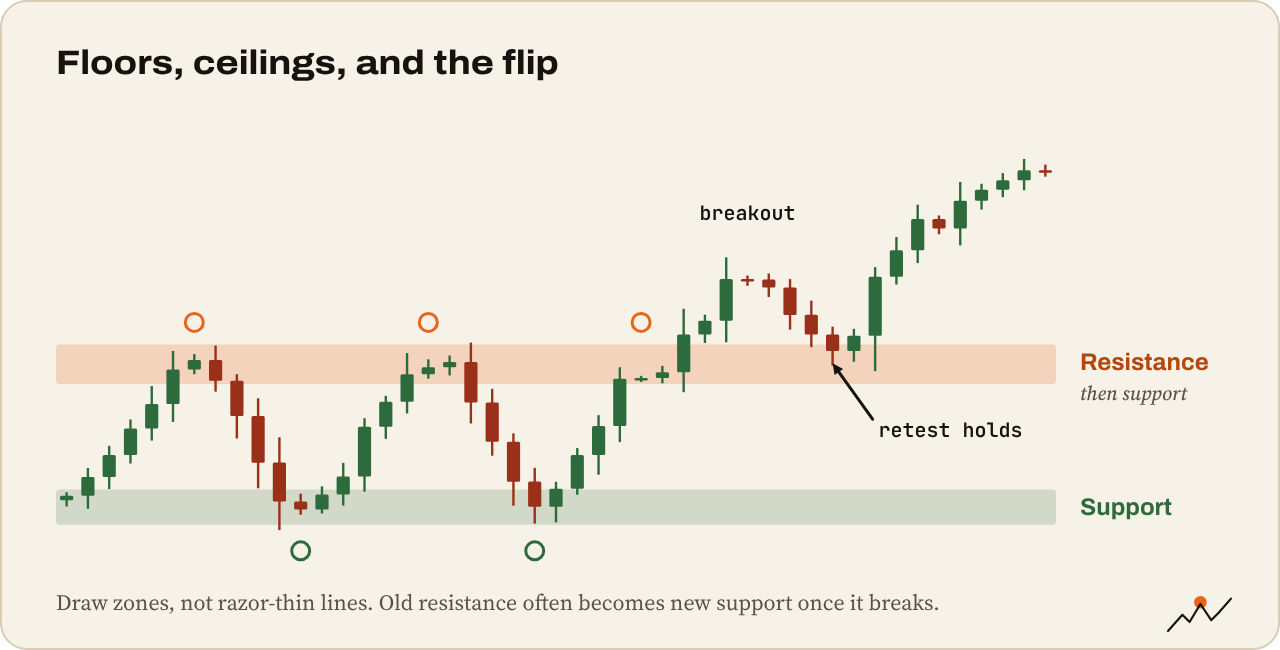
- Support is a price zone where falls have stopped before. Buyers showed up there, so it acts like a floor.
- Resistance is a price zone where rises have stopped before. Sellers showed up, so it acts like a ceiling.
When price sits between the two, bouncing up and down, that’s a range. Markets spend a lot of their time in ranges.
Why they work
Support and resistance aren’t magic. They come from people remembering prices.
Say Bitcoin bounced hard from $75,000 last month. Traders who bought there made money and want to buy again if it returns. Traders who missed it are waiting for a second chance. Traders who sold too early want back in. When price comes back to $75,000, all those orders meet it at once. That’s support.
Resistance works the same way in reverse. People who bought at $90,000 and watched it fall want to “get out at break-even” when price returns. Their sell orders cap the rally.
In other words, a level is a crowd of orders waiting at a price. The more people watching it, the stronger it tends to be.
How to draw them
- Start on the daily or weekly chart. Levels on higher timeframes matter more.
- Look for clear reactions: spots where price turned sharply, more than once. Swing highs and swing lows.
- Draw a horizontal zone, not a razor-thin line. Price rarely turns at exactly the same dollar. Use the candle bodies and wicks around the turns to set the top and bottom of the zone.
- Keep only the obvious ones. If you have to squint, it’s not a level. Two or three per chart is usually enough.
Tip. A good test: would another trader looking at the same chart draw the same level? If yes, it’s probably real. If only you can see it, delete it.
Round numbers and old highs
Some levels matter even without a past bounce:
- Round numbers like $100,000 for Bitcoin or $1 for an altcoin. People place orders and take profit at round figures.
- The all-time high: above it there’s no one left who bought higher and wants out, which is why breaks of the ATH can run fast.
- Big previous highs and lows from months or years ago, visible on the weekly chart.
When a floor becomes a ceiling
When price breaks through a level, the level doesn’t vanish. It often switches roles:
- Old resistance that breaks often becomes new support on the way back down.
- Old support that breaks often becomes new resistance on the way back up.
This return to a broken level is called a retest. Many traders prefer to buy a retest of broken resistance rather than chase the breakout itself.
Breakouts and fakeouts
A breakout is a move through a level with conviction. A fakeout is a move through a level that quickly reverses back, trapping everyone who jumped in.
Crypto is full of fakeouts, often because price runs to where lots of stop-losses sit, triggers them, and turns. A few ways to tell them apart:
- Wait for the close. A wick above resistance is not a breakout. A daily close above it is a start.
- Watch volume. Real breakouts usually come with rising volume.
- Watch the retest. If price comes back to the level and holds, the break is more believable.
Levels get weaker with every test
It sounds backwards, but a level tested five times is often weaker than one tested twice. Each test uses up some of the orders waiting there. When a support gets hit again and again with smaller and smaller bounces, buyers are running out. That’s often when it finally breaks.
Watch out. Support and resistance tell you where something might happen, not what will happen. Price can slice through any level, especially on big news. That’s why traders pair levels with a stop-loss, which you’ll learn about in the Ridge guides on risk management.
Try it on a real chart
- Open BTC/USD on the weekly chart and mark the two or three clearest levels
- Switch to daily. Are your weekly levels still visible there?
- Find one level that flipped from resistance to support (or the other way)
- Find a fakeout: a wick through a level that closed back inside
Tip. For a deeper dive, CryptoCred’s Horizontal Support/Resistance covers which levels matter and which to skip.
Where to go next
Charts show you the price. But a $0.001 coin can be more expensive than a $50,000 one. Find out why in Market cap, supply and why “cheap” coins aren’t cheap.

On the climb since 2017. Trades futures and reads onchain data. Automates the boring parts.
More from VikingXBT →