
The short version
- A trendline needs at least two clear touches to draw and a third to trust. Steep lines break fast.
- Ranges have three key levels: the high, the low and the midpoint. Trade the edges, not the middle.
- Real breakouts close beyond the level, come with volume and often retest it. Most breakouts on low volume fail.
- When a breakout fails and price returns inside the range, the move often runs to the other side.
Markets spend a lot of time either trending or going sideways. Trendlines help you frame the first. Ranges describe the second. Breakouts are the moment one turns into the other, and they’re where traders make and lose the most money.
This guide covers all three, with a focus on what actually works on crypto charts, which are full of wicks, weekend moves and traps.
Drawing trendlines
A trendline connects swing points in a trend:
- In an uptrend, connect two or more higher lows. The line sits under price, acting as rising support.
- In a downtrend, connect two or more lower highs. The line sits above price, acting as falling resistance.
Rules that keep trendlines useful:
- Two touches draw it, three confirm it. Any two points make a line. The third touch is what shows the market respects it.
- Be consistent with wicks or bodies. Many traders use wicks; some use candle bodies to ignore spikes. Pick one and stick to it.
- Don’t force it. If you have to cut through several candles to make a line fit, it’s not a real trendline.
- Use log scale on long-term charts. On linear scale, long crypto trendlines drift out of place.
Steep vs shallow lines
The angle tells you a lot:
- Steep trendlines (parabolic moves) break quickly. When they do, price often doesn’t fall apart. It just slows down to a more normal pace.
- Shallow trendlines that hold for months carry more weight. A break of a long, tested line is a real event.
A trendline break isn’t automatically a reversal. Often the trend simply moves sideways for a while. Confirm with market structure: a broken trendline plus a broken higher low is much stronger than either alone. See Market structure.
Channels
When you can draw a parallel line on the other side of the trend, touching the swing highs of an uptrend, you have a channel. Channels give you a rough zone for targets: buy near the lower line, take profit near the upper one.
Don’t over-trust them. Channels are tidy in hindsight and messy in real time.
Ranges: the sideways market
A range forms when price bounces between a clear high and a clear low. Crypto spends a lot of time like this, often weeks or months after a big move.
Mark three levels:
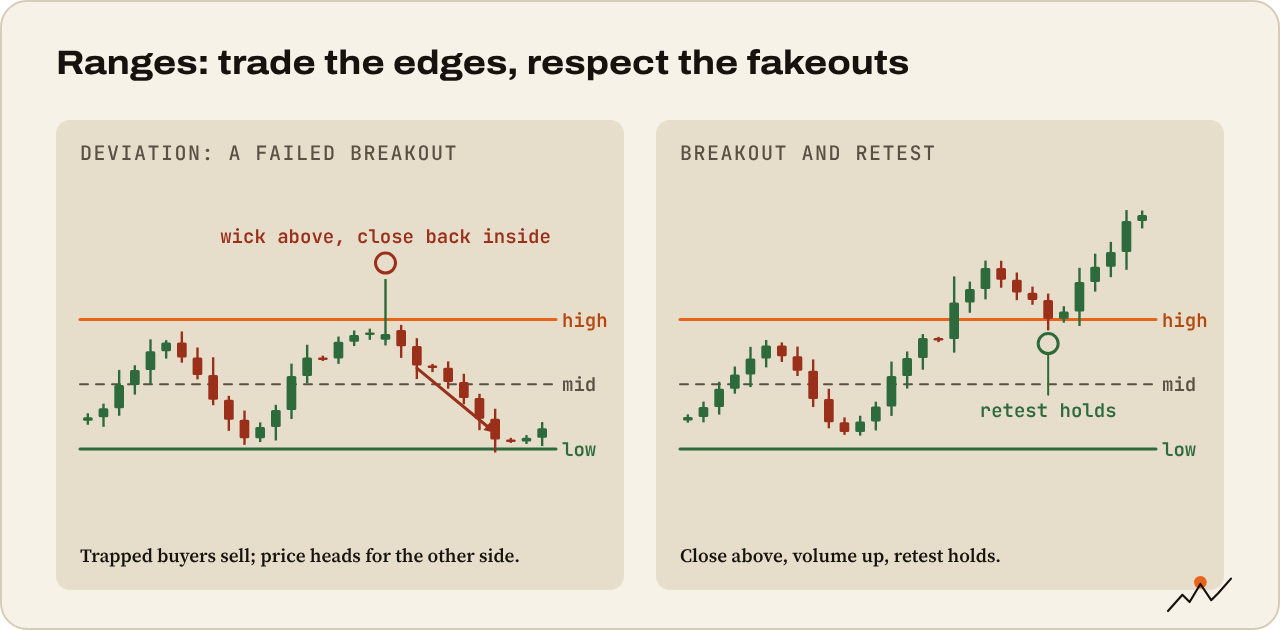
- Range high: the resistance at the top.
- Range low: the support at the bottom.
- Midpoint: exactly halfway. Price often reacts here too, and it splits the range into a “cheap” lower half and an “expensive” upper half.
How range traders use it:
- Buy near the range low, sell or short near the range high. Stops just beyond the edge.
- Don’t trade the middle. Risk/reward is poor in no-man’s-land.
- Use the midpoint as a first target and a rough line in the sand. Price holding above the midpoint leans bullish; below, bearish.
Breakouts
A breakout is when price leaves a range or crosses a trendline with conviction. It can kick off a big move, because orders that were waiting outside the range (stops and breakout entries) all trigger at once.
Signs of a real breakout:
- A close beyond the level on your timeframe, not just a wick.
- Rising volume. Big breakouts come with big participation.
- Follow-through: the next candles keep moving away instead of hovering.
- A successful retest: price comes back to the broken level and it holds from the other side.
Two ways to trade them:
- Enter on the close above the level. You catch more of the move, but more fakeouts too.
- Enter on the retest. You miss some breakouts that never look back, but your stop is tighter and your entry better.
Tip. Context matters more than the breakout itself. A breakout in the direction of the higher-timeframe trend has better odds than one against it. A range breaking up in a weekly uptrend is a different trade from one breaking up in a weekly downtrend.
Fakeouts and failed breakouts
A fakeout is a break that quickly reverses back into the range. Crypto is full of them, partly because so many traders place stops just outside obvious ranges. Price runs to those stops, fills the orders, and turns.
Clues a breakout may fail:
- It happens on a weekend or during thin hours with low volume.
- Only a wick goes through; the candle closes back inside.
- Funding rates spike, meaning traders chased the breakout with leverage.
- It runs straight into a higher-timeframe level.
Here’s the useful part: a failed breakout is a signal too. When price breaks above a range, fails and closes back inside, trapped buyers need to get out. The move often travels all the way to the range low. Many experienced traders like the failed breakout more than the breakout itself.
Watch out. Don’t chase a candle that has already moved far from the level. Your stop has to go back behind the level, which makes the risk/reward poor. If you missed it, wait for the retest or let it go.
Practice
- Find a clear range on the BTC or ETH daily chart and mark the high, low and midpoint
- Find a breakout from it: did it close beyond the level, with volume, and retest?
- Find a failed breakout. Where did price go next?
- Draw one trendline with at least three touches. When did it break, and what happened?
Tip. CryptoCred’s Trendlines (12 minutes) and Retests are good companions to this guide. For failed moves, see his Pattern Failure.
Where to go next
Price action gives you the map. Indicators can add a second opinion: Indicators worth knowing: moving averages, RSI, volume.

On the climb since 2017. Trades futures and reads onchain data. Automates the boring parts.
More from VikingXBT →