
The short version
- Moving averages smooth price into a trend line. The 50-day and 200-day are the ones the market watches most.
- RSI measures momentum. In strong trends it stays “overbought” or “oversold” for weeks, so use it for ranges and divergence, not as a sell button.
- Volume shows participation. Moves on rising volume are more trustworthy than moves on fading volume.
- Indicators confirm price action. They don’t replace it, and stacking ten of them doesn’t help.
Open TradingView’s indicator list and you’ll find thousands of them. New traders often stack six on one chart and end up with a rainbow that says buy and sell at the same time.
The truth is that most indicators are just price, run through a formula. They can’t know anything price doesn’t. A few, though, are worth having: they summarize trend, momentum and participation in a way that’s quicker to read than raw candles. This guide covers those three, and how not to misuse them.
Moving averages: the trend at a glance
A moving average (MA) is the average closing price over the last N candles, recalculated with each new candle. It turns a jagged chart into a smooth line that shows the trend.
Two types:
- SMA (simple moving average): every candle counts equally.
- EMA (exponential moving average): recent candles count more, so it reacts faster.
Neither is better. EMAs suit shorter-term trading; SMAs are common for the big long-term averages. What matters more is using the same ones the market watches.
The moving averages that matter
| Average | What traders use it for |
|---|---|
| 20 EMA | Short-term trend; strong trends often pull back to it |
| 50-day | Medium-term trend; a common dynamic support or resistance |
| 200-day | The big one. Above it is broadly bullish, below it broadly bearish |
| 200-week | Bitcoin’s very long-term average, historically near bear market lows |
How to read them:
- Price above a rising MA: uptrend. Pullbacks to the MA can be buying areas.
- Price below a falling MA: downtrend. Rallies to the MA can be selling areas.
- Price chopping across a flat MA: no trend. The MA is useless here; switch to range thinking.
- The slope matters as much as the position. A flattening 200-day says the trend is losing steam.
The 200-week MA has a famous record on Bitcoin: price held near it at several bear market lows. But in 2022, BTC fell well below it for months. Treat it as context, not a guaranteed floor.
Golden cross and death cross
When the 50-day MA crosses above the 200-day, it’s called a golden cross. When it crosses below, a death cross.
They make great headlines and they’re slow. By the time two long averages cross, price has usually moved a lot already. Many death crosses in crypto have come close to local bottoms, and golden crosses near local tops. Use them as a confirmation of the bigger picture, not as an entry signal.
RSI: momentum
The RSI (Relative Strength Index) compares the size of recent up-moves with recent down-moves and turns it into a number between 0 and 100. The default setting looks back 14 candles.
The textbook reading:
- Above 70: overbought.
- Below 30: oversold.
Here’s the problem. In a strong trend, RSI can sit above 70 for weeks while price keeps rising. Shorting every time RSI hits 70 in a bull market is a famous way to lose money. Overbought means strong, not “about to drop.”
Better ways to use RSI:
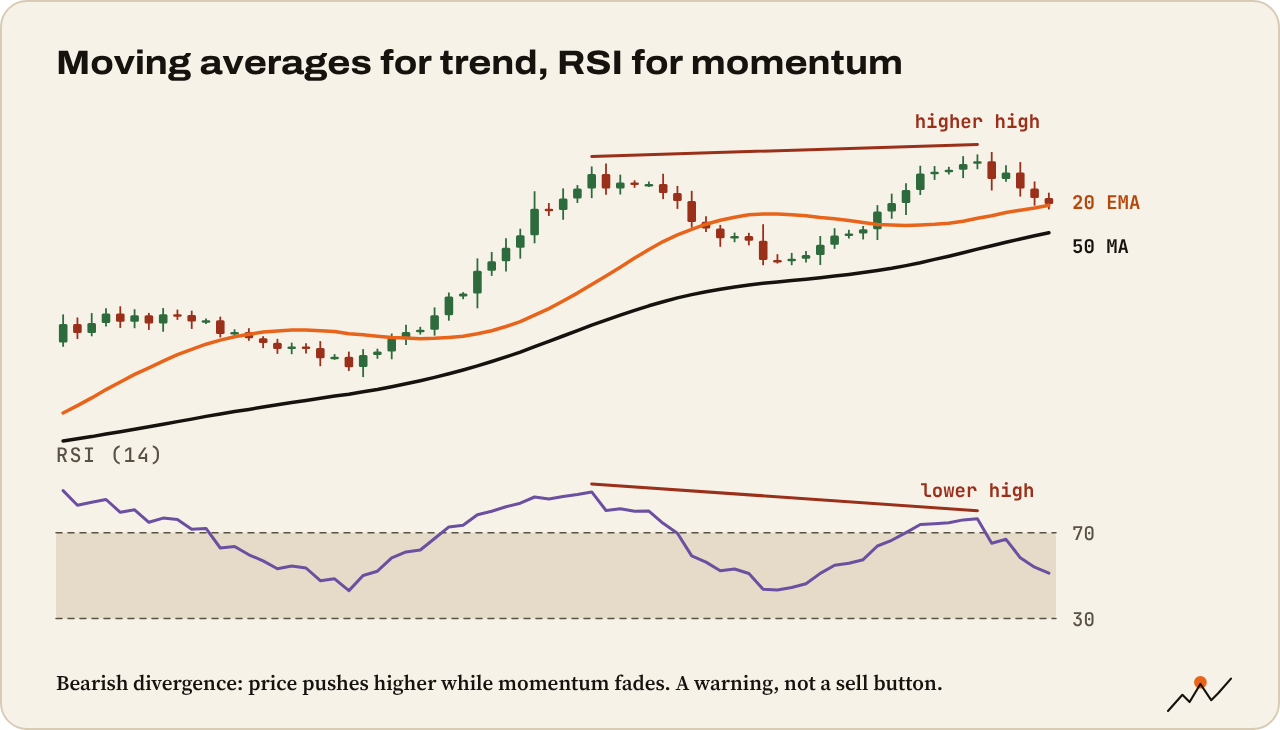
- RSI ranges. In uptrends, RSI tends to swing between about 40 and 80, and dips to 40–50 are often buying areas. In downtrends, it tends to swing between about 20 and 60. When the range shifts, the trend may be shifting.
- Divergence. Price makes a higher high, but RSI makes a lower high: momentum is fading (bearish divergence). Price makes a lower low, but RSI makes a higher low: selling is weakening (bullish divergence).
- The 50 line. RSI holding above 50 on the daily is a simple sign that buyers are in control.
Watch out. Divergence can last a long time. Price can print three or four divergences in a row and keep going. Treat it as a warning to tighten stops or skip new entries, and wait for price structure to confirm, such as a break of the last higher low.
Volume: participation
Volume is the one indicator that isn’t calculated from price. It shows how much was traded, which tells you how many people care about a move.
What to look for:
- Trend with rising volume: healthy. New money is joining.
- Trend with falling volume: tiring. Fewer people are pushing.
- Breakouts on high volume: more likely to hold. Breakouts on thin volume often fail (see Trendlines, ranges and breakouts).
- A volume spike at the end of a long drop: often capitulation, when the last sellers give up.
Two related tools you’ll hear about:
- VWAP (volume-weighted average price): the average price weighted by volume, often reset daily. Intraday traders use it as a fair-value line.
- Volume profile: shows how much traded at each price level. Price levels with lots of volume tend to act as magnets and support or resistance.
Crypto volume has a catch: it’s spread across many exchanges and some report inflated numbers (wash trading). Compare volume on the same exchange over time rather than between exchanges.
Putting them together
A clean setup can combine all three without clutter:
- Trend: price above a rising 200-day MA. Look for longs only.
- Location: price pulls back to the 50-day MA, which lines up with a horizontal support.
- Momentum: daily RSI dips into the 40–50 zone and turns up.
- Participation: the bounce comes with rising volume.
Several reasons pointing the same way is called confluence. It doesn’t make a trade certain. It makes it better than one that only has one reason.
Tip. Keep a clean chart: two or three moving averages, RSI and volume are plenty. If you add an indicator, be able to say what it tells you that the others don’t. For more on RSI, CryptoCred’s Relative Strength Index goes far beyond overbought and oversold.
Practice
- Add the 50 and 200-day MAs to the BTC daily chart. Is price above or below each, and which way are they sloping?
- Find the last golden or death cross. How much had price moved before it happened?
- Add RSI. In the last uptrend, where did RSI bottom on pullbacks?
- Find a divergence. Did price structure confirm it?
- Find the biggest volume spike of the year. Was it a breakout, a top or a capitulation?
Where to go next
You’ve finished the Price action series. Next, the tools that multiply both gains and mistakes: Futures and leverage explained.

On the climb since 2017. Trades futures and reads onchain data. Automates the boring parts.
More from VikingXBT →