
The short version
- Realized price is the average price at which every bitcoin last moved: the market’s cost basis. MVRV compares today’s price with it.
- MVRV near or below 1 has marked every major Bitcoin bear market low. High readings have marked tops, though each cycle peaks lower.
- The short-term holder cost basis acts as a pivot: support in bull trends, resistance in bear trends.
- Exchange flows, stablecoin supply and ETF flows show where coins and dollars are moving. None of these work as timing signals alone.
A price chart shows you what the last trade was. The Bitcoin blockchain shows you something no stock market can: when every coin last moved, and at what price. Add those up and you get the market’s average cost basis, how much profit holders are sitting on, and who is moving coins to exchanges to sell.
That’s on-chain analysis. It’s most useful on the high timeframe, for judging where Bitcoin sits in its cycle. This guide covers the metrics that have a real track record, and the traps in reading them.
Realized price: the market’s cost basis
Market cap values every bitcoin at today’s price. Realized cap values every bitcoin at the price when it last moved on-chain. A coin bought at $20,000 and untouched since counts at $20,000.
Divide realized cap by the number of coins and you get the realized price: roughly, the average price the market paid for its coins.
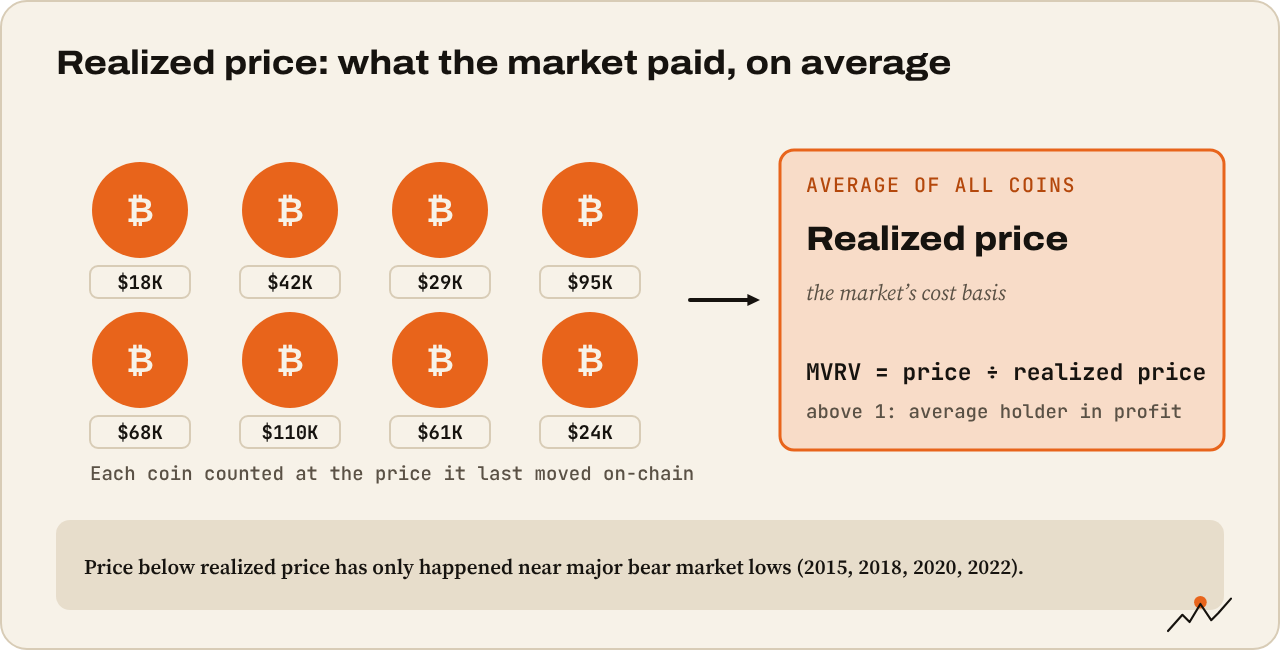
Why it matters:
- Price above realized price: the average holder is in profit.
- Price below realized price: the average holder is underwater. Historically rare, brief and close to generational lows: 2015, late 2018, a few days in March 2020, and late 2022.
MVRV: how stretched is price?
MVRV is market value divided by realized value: today’s price ÷ realized price.
- MVRV 1: price equals the market’s cost basis.
- Below 1: the average coin is held at a loss. Every major cycle bottom has come with MVRV near or below 1.
- High readings: the average holder sits on large unrealized profits. The temptation to sell builds. Past cycle tops came with MVRV well above 3, but each cycle’s peak reading has been lower than the last, in line with Bitcoin’s diminishing returns.
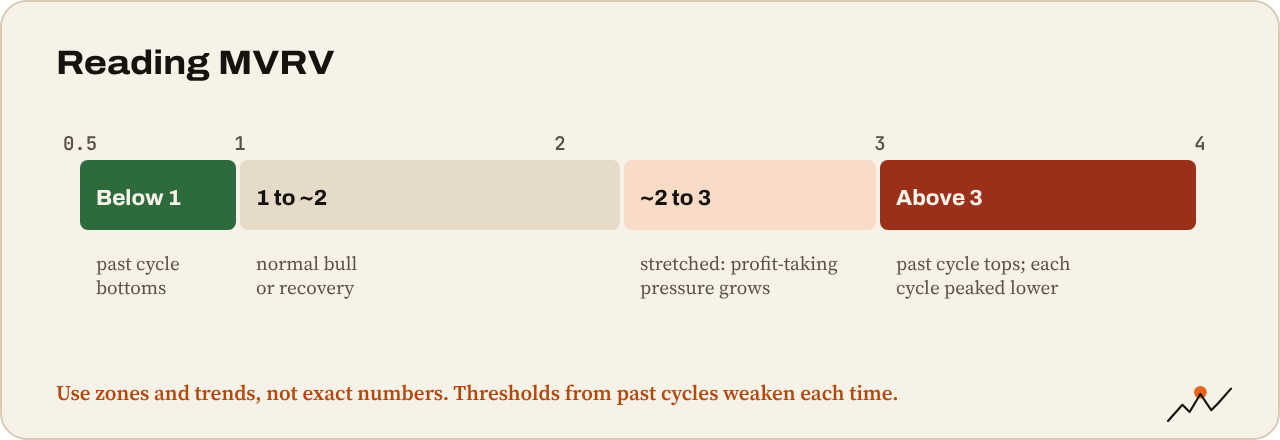
A refinement, the MVRV Z-score, measures how far market cap sits from realized cap in standard deviations. It adjusts for the shrinking volatility and is a popular cycle-top gauge, with the same caveat: fixed thresholds from past cycles get weaker each time.
Short-term and long-term holders
On-chain analysts split holders by how long coins have been held. The common cut-off is 155 days: coins older than that are statistically unlikely to move soon.
- Short-term holders (STH): newer buyers, more price-sensitive.
- Long-term holders (LTH): coins held more than 155 days.
Each group has its own realized price. The STH realized price (the cost basis of recent buyers) is one of the most useful levels on any Bitcoin chart:
- In bull trends, pullbacks to it are often bought, because recent buyers defend their break-even.
- In bear trends, rallies to it often fail, because underwater buyers sell at break-even.
In late September 2026, Glassnode data put the STH cost basis at roughly $73,000, with Bitcoin trading about 15% above it. Watching whether price holds above or loses that level tells you whether recent buyers are in control.
Long-term holder behavior matters too: LTH supply falling fast usually means old coins being sold into strength, a feature of late bull markets. LTH supply rising means coins maturing into strong hands, typical of bear markets and accumulation.
SOPR and NUPL: profit taken and profit held
- SOPR (Spent Output Profit Ratio): for coins that moved today, the selling price ÷ the price they last moved at. Above 1 means coins are being sold at a profit on average; below 1, at a loss. In bull markets, dips of SOPR to 1 tend to be bought (people won’t sell at a loss). In bear markets, rallies to 1 tend to be sold.
- NUPL (Net Unrealized Profit/Loss): the share of market cap that is unrealized profit. Often shown in colored zones from capitulation (negative) through hope and optimizm to belief and euphoria (above about 0.75). A quick read on crowd mood based on actual profit.
Exchange flows
Coins moving onto exchanges are often heading for sale. Coins leaving exchanges are often heading for cold storage.
- Exchange netflow: inflows minus outflows. Large inflows during a rally can warn of selling; sustained outflows suggest accumulation.
- Exchange reserves: total BTC on exchanges. They’ve trended down for years as holders self-custody and ETFs hold coins with custodians.
- Whale inflows: large single deposits, sometimes ahead of big moves.
Treat these carefully. Exchanges shuffle coins between their own wallets, ETF custodians look like exchanges to some tools, and labelling is imperfect. Big flows are worth a closer look, not an automatic signal.
Stablecoins and ETF flows: dry powder and demand
- Stablecoin supply: total stablecoins grew past $300 billion in 2026. Rising supply means more dollars on-chain that can buy crypto. Stablecoins flowing into exchanges often show buying intent.
- Spot ETF flows: daily net inflows and outflows of US Bitcoin and Ethereum ETFs, published by issuers and tracked by sites like Farside and CoinGlass. Since 2024 they’re one of the biggest sources of spot demand. A run of strong inflows tends to support price; persistent outflows tend to weigh on it.
Miners
Miners are natural sellers: they pay for electricity in dollars. Watch miner reserves and hash rate. After a halving, weaker miners can be forced to sell or shut down, and a “hash ribbon” signal (short-term hash rate falling below long-term, then recovering) has historically come near miner capitulation and local lows.
How to use on-chain data
- High timeframe only. On-chain data is slow. It’s great for “where are we in the cycle?” and poor for “where do I enter today?”
- Look for agreement. MVRV near 1, price below the STH cost basis, SOPR under 1 and negative NUPL together describe a market near capitulation. Any one alone means less.
- Turn levels into chart levels. Plot the realized price and STH realized price on your price chart. They act like support and resistance.
- Distrust exact thresholds. “MVRV 3.7 is the top” worked until it didn’t. Use zones and trends, not magic numbers.
Tip. Checkonchain (free charts) and Glassnode publish most of these metrics. James Check’s Identify Bitcoin Market Tops With These Insightful Charts shows how an on-chain analyst actually reads them.
Watch out. On-chain metrics are built from assumptions (that a coin moving means a sale, that one entity owns one wallet). Exchanges, ETFs, custodians and lost coins all bend the numbers. They describe the market well; they predict it less well.
Monthly on-chain check
- Price vs realized price and vs STH realized price
- MVRV: near 1, middle of the range or stretched?
- SOPR and NUPL: who’s taking profit, and how much is on the table?
- Long-term holders: accumulating or distributing?
- Exchange netflows and reserves over the last month
- Stablecoin supply and ETF flows: is new money coming in?
Where to go next
On-chain data tells you about Bitcoin. Next, how money moves from Bitcoin to everything else: Altcoin season: rotation and BTC dominance.

On the climb since 2017. Trades futures and reads onchain data. Automates the boring parts.
More from VikingXBT →