
The short version
- The halving cuts new Bitcoin supply in half roughly every four years. The last one was April 20, 2024; the next is expected around April 2028.
- Each cycle so far peaked about 12 to 18 months after a halving, then fell 75% to 85%. The 2025 peak came 534 days after the 2024 halving.
- Returns shrink every cycle: about 95x from halving to peak in 2012, around 2x in 2024. Drawdowns have shrunk too.
- The halving’s direct supply effect is now small. Liquidity, ETFs and the crowd’s belief in the cycle matter at least as much.
No pattern in crypto is watched as closely as Bitcoin’s four-year cycle. Halving, rally, euphoric top, brutal bear market, repeat. It has happened often enough that millions of people now trade it, which raises a fair question: does it still work, and why did it ever work?
This guide lays out the data from every cycle, the main explanations for it, and the reasons serious analysts think the pattern is changing. It’s the high-timeframe view that frames everything else.
What the halving is
New bitcoin are created as a reward to miners for each block, roughly every ten minutes. Every 210,000 blocks, about every four years, that block reward is cut in half. That’s the halving.
| Halving | Date | Block | Reward after |
|---|---|---|---|
| Launch | January 2009 | 0 | 50 BTC |
| 1st | November 28, 2012 | 210,000 | 25 BTC |
| 2nd | July 9, 2016 | 420,000 | 12.5 BTC |
| 3rd | May 11, 2020 | 630,000 | 6.25 BTC |
| 4th | April 20, 2024 | 840,000 | 3.125 BTC |
| 5th | Expected around April 2028 | 1,050,000 | 1.5625 BTC |
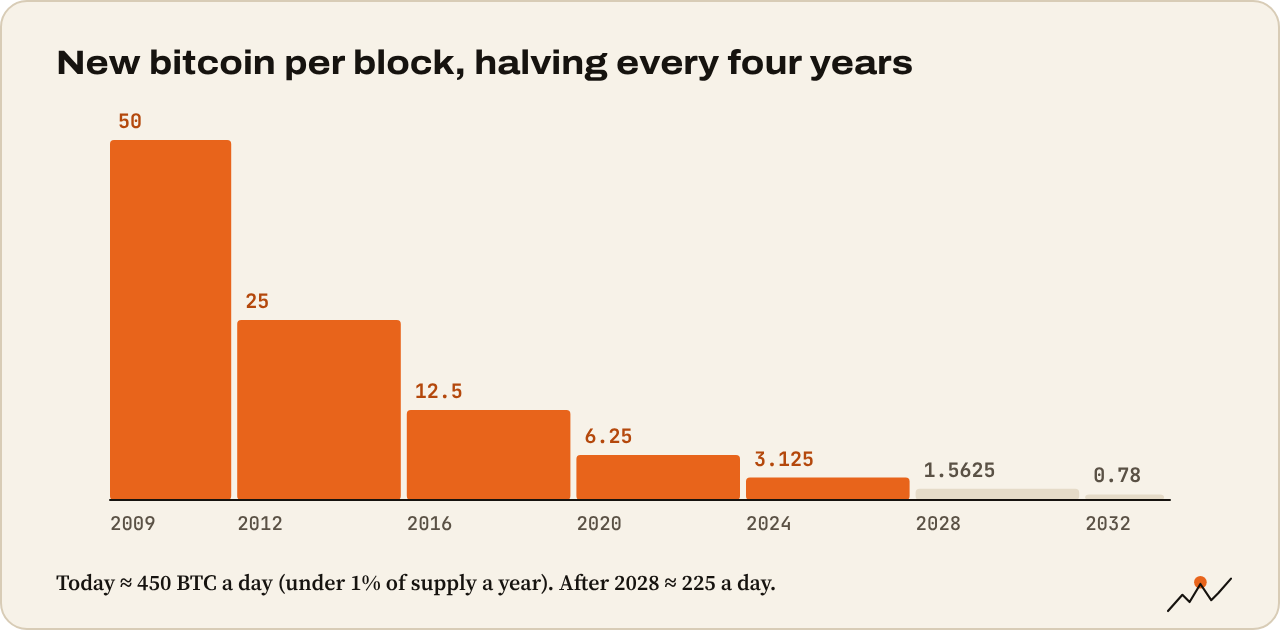
Today miners create about 450 BTC a day. After 2028, about 225. Roughly 20.1 million of the 21 million coins already exist. Our halving tool estimates the next date from the current block height and recent block times:
Base Camp tool
Bitcoin halving countdown
An estimate of when the next halving cuts the block reward from 3.125 to 1.5625 BTC.
Estimated from the average block time since the April 2024 halving (about 10 minutes). The real date can move by days. For learning only, not financial advice.
The cycle in the data
Here’s each cycle measured from halving to peak to bear market low. Figures from 2016 on are Binance daily closes; 2012–2015 are approximate, from the thin markets of the time.
| Halving | Price at halving | Cycle peak | Days after halving | Bear market low | Drawdown |
|---|---|---|---|---|---|
| Nov 2012 | ~$12 | ~$1,150 (Dec 2013) | ~370 | ~$170 (Jan 2015) | about −85% |
| Jul 2016 | ~$650 | $19,103 (Dec 16, 2017) | 525 | $3,212 (Dec 15, 2018) | −83% |
| May 2020 | $8,562 | $67,526 (Nov 8, 2021) | 546 | $15,781 (Nov 21, 2022) | −77% |
| Apr 2024 | $64,941 | $124,659 (Oct 6, 2025) | 534 | $58,625 so far (Jun 30, 2026) | −53% so far |
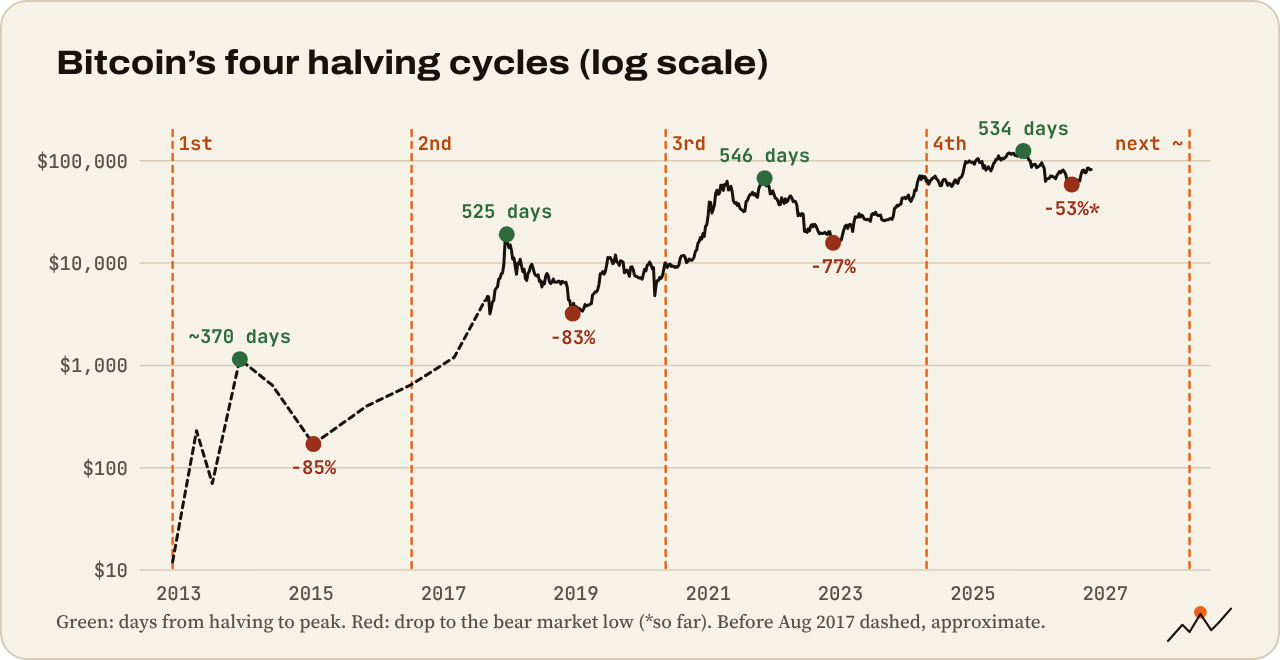
Three patterns stand out:
- Timing. The last three peaks came 525 to 546 days after the halving. The bear market lows came about a year after each peak.
- Diminishing returns. From halving price to peak: about 95x, 29x, 8x and 1.9x. Each cycle’s gain is a fraction of the last.
- Shrinking drawdowns. From −85% to −83% to −77%. The current cycle’s drop to the June 2026 low was −53%, measured on daily closes.
Why the cycle has happened
There are three main explanations, and they probably all play a part.
1. The supply shock. Miners sell much of their new coins to pay for electricity. When the reward halves, the steady sell pressure from new supply halves too. If demand holds, price has to rise to balance it. In 2012, new issuance was more than 10% of supply a year, so the shock was big. Today it’s under 1% a year, and after 2028 it falls to about 0.4%.
2. The liquidity cycle. Bitcoin has tracked global liquidity (central bank balance sheets, money supply, interest rates) closely. Several halvings happened to line up with easing cycles: 2020’s halving came as central banks flooded markets after Covid. Some analysts argue the four-year rhythm is really a liquidity and debt-refinancing rhythm, and the halving is a coincidence of timing.
3. Reflexivity. Enough people believe in the cycle that they act on it: buying a year before the halving, selling about 18 months after. A pattern that many traders follow can partly fulfill itself, until enough of them try to front-run it.
Tip. Benjamin Cowen’s Bitcoin Market Cycle Theory is a long, data-heavy look at the cycles and the risk around them.
The four phases
Cycle traders often describe four phases. They help you name where the market might be, even if the boundaries are only clear in hindsight:
- Accumulation: after the bear market low. Price ranges, sentiment is dead, long-term holders buy. Volatility is low.
- Markup: price reclaims key levels like the 200-week moving average and the realized price, makes higher highs, and breaks the previous all-time high.
- Distribution: euphoria, parabolic moves, memecoins everywhere, mainstream headlines. Long-term holders sell into strength.
- Markdown: the bear market. Lower highs, failed rallies, capitulation events, sometimes a crypto winter lasting a year or more.
On-chain data helps locate these phases. That’s the next guide: On-chain metrics that matter.
What may be changing
Each cycle the market looks a little less like the old ones. Reasons to be careful with the template:
- ETFs and institutions. Since January 2024, US spot ETFs hold a large and growing share of supply. Their flows, driven by asset allocators and macro, can dwarf miner selling. The 2024 cycle was the first where Bitcoin set a new all-time high before the halving (in March 2024).
- Smaller supply effect. With 450 BTC a day of new issuance, a single day of strong ETF flows can absorb weeks of mining output.
- Lower volatility. A bigger, more widely held asset moves less. Smaller tops and shallower bottoms fit the diminishing-returns pattern.
- Everyone knows. When a pattern is this famous, front-running it shifts the timing.
The current cycle illustrates the debate. The peak timing (534 days after the halving) fit the old pattern almost to the week. The drop to the June 2026 low was much shallower than previous bear markets and came faster: 267 days after the peak, against about a year in the last two cycles. Whether that low holds as the cycle bottom, or the market makes a lower low later, is exactly the kind of question the old template can’t answer alone.
How to use cycles without being used by them
- As a high-timeframe map, not a calendar. Cycles tell you which phase is more likely, not what happens next week.
- For risk, not targets. Late in a cycle, after a long rally with euphoric sentiment, reduce leverage and take some profit, however bullish you feel. Deep in a bear market, consider a DCA plan instead of trying to catch the exact low.
- Combine with on-chain and liquidity data. If the calendar says “top” but valuation metrics are modest and liquidity is expanding, be open to the cycle stretching.
- Respect the drawdowns. Even shrinking drawdowns of 50% or more are life-changing if you’re leveraged. Plan for the next one now.
Watch out. Four cycles is a tiny sample. Any pattern fitted to four data points can break on the fifth. Use the cycle as context and keep your risk rules no matter what the calendar says.
Cycle checklist
- Where are we in time: months since the halving, months since the last peak or low?
- Is price above or below the 200-week moving average and the realized price?
- What is sentiment doing: euphoria, disbelief or apathy?
- What are global liquidity and interest rates doing?
- Are ETF flows and long-term holders buying or selling?
- Does my position size survive a 50% to 75% drawdown?
Where to go next
The blockchain itself records who bought when, and at what price. Next: On-chain metrics that matter: MVRV, realized price and exchange flows.

On the climb since 2017. Trades futures and reads onchain data. Automates the boring parts.
More from VikingXBT →