The short version
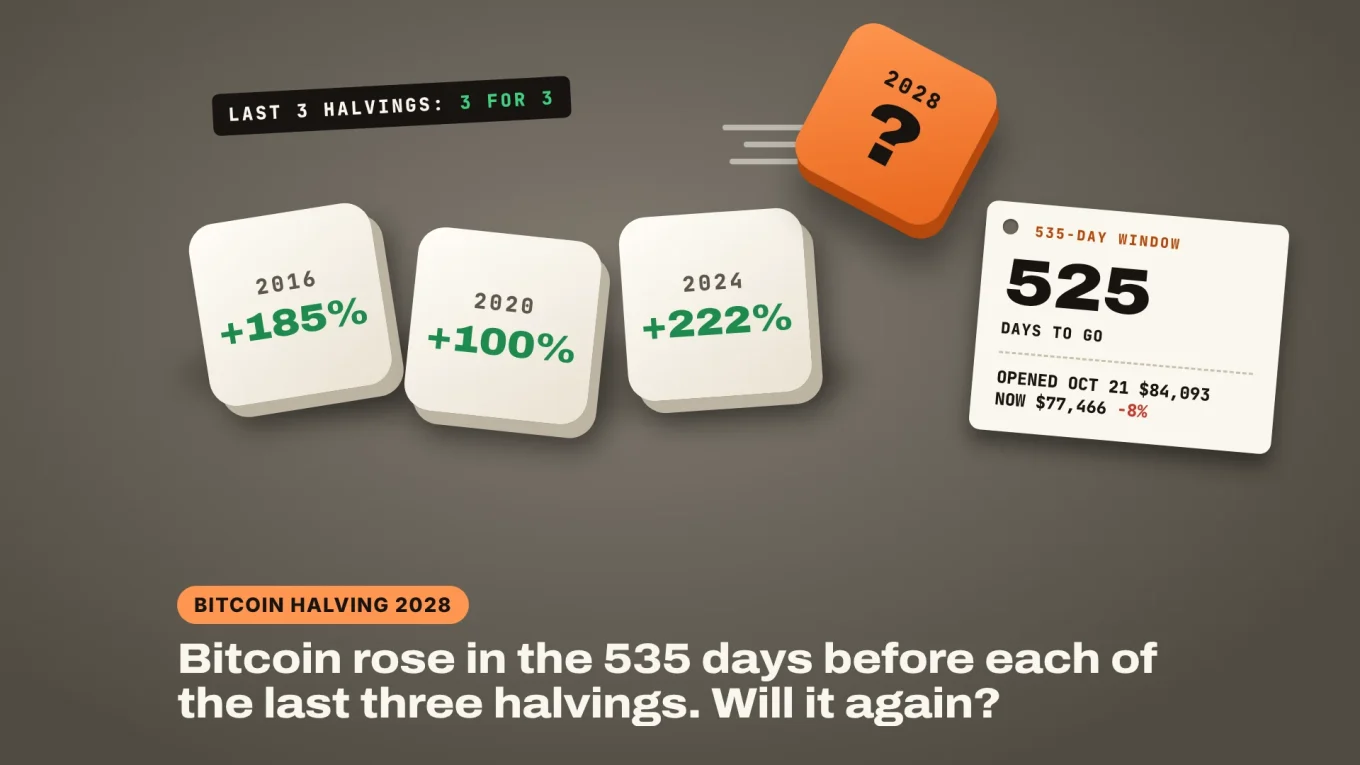
- Bitcoin halving 2028: in each of the last three cycles, BTC ended the 535 days before the halving higher, by 185%, 100% and 222%.
- The stat holds for any window from 352 to 727 days, but each earlier one opened after a 70–80% crash; this one opened October 21 at $84,093, about a third under the record.
- The crew is watching $76,264 support and whether Bitcoin can close back above $84,093, with the halving about 525 days away (estimated April 8, 2028).
The Bitcoin halving 2028 countdown has a new stat doing the rounds. In each of the last three halving cycles, Bitcoin finished the 535 days before the halving higher than it started. If the next halving lands around April 8, 2028, that window opened on October 21, 2026.
So the clock is running. Bitcoin closed that day at $84,093 on Binance and trades at $77,466 at the time of writing, 8% below where the window opened.
We pulled the daily closes and tested the claim: whether it holds, how much it depends on the number 535, and what is different this time.
The stat comes from this chart, posted on Saturday:

$BTC has never lost money in the 535 days before a halving.
Three data points. Skeptics call that luck. Holders call it supply math.
The next halving lands in April 2028. GAME ON 💥
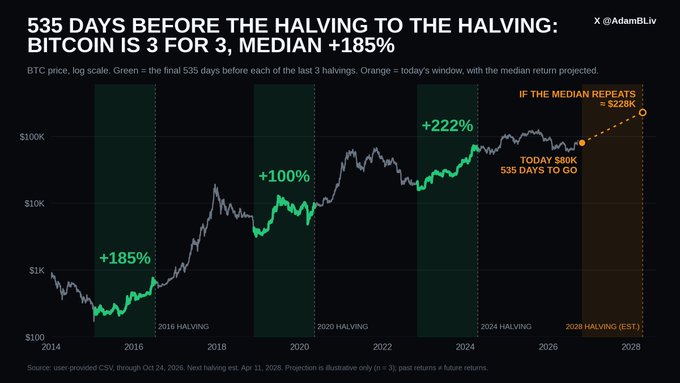
Does the 535-Day Halving Stat Hold Up?
Yes, for the three cycles it covers. Our numbers from Bitstamp’s daily closes, the longest unbroken record, match the chart exactly:
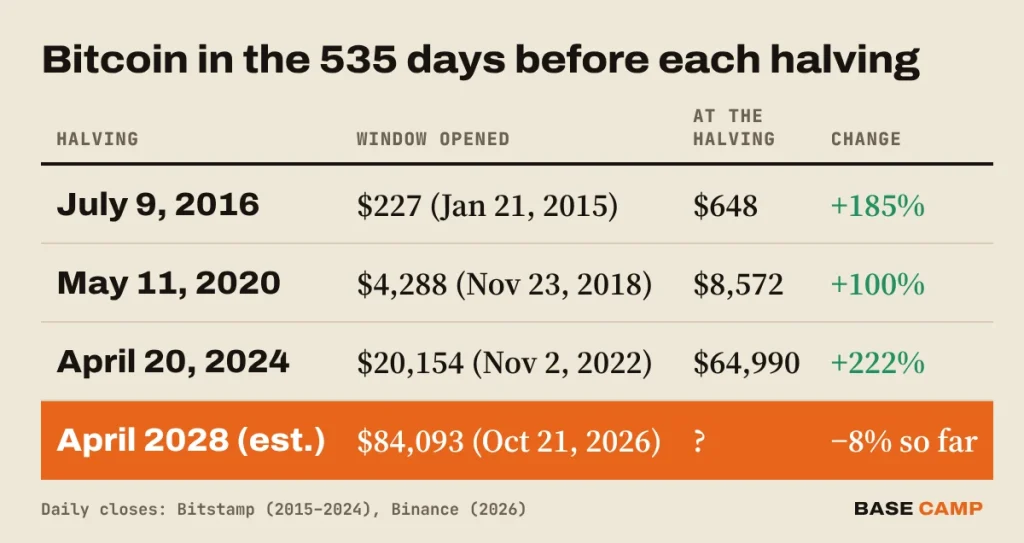
None of the three was a straight line up. In the 2020 window, Bitcoin fell as much as 27% below its starting price within a month, then fell again in the March 2020 crash before the halving rescued the number. In the 2024 window, it sank to $15,766 after the FTX collapse, 22% under the start.
Bitcoin halving history is also a small sample: three results. A coin that lands heads three times in a row does that one time in eight.
Sponsored · Affiliate link
Save 20% on fees trading on WEEX
Base Camp may earn a commission if you sign up. It never affects what we write.
Is 535 Days a Magic Number?
No, and that is the better news for the stat. We ran every window length from one day to 900 days. Any window from 352 to 727 days before the halving was positive in all three cycles, so 535 sits in the middle of a wide range, not on a lucky edge.
Shorter windows work too: a full year before each halving, Bitcoin was up 127%, 23% and 138%. Push it further back, though, and it breaks. Two years out (730 days), the 2020 cycle was up only 1%. At 800 days, it was down 25%, because that start date lands in the 2018 sell-off.
The start date does most of the work. Each earlier window opened close to the bottom of its Bitcoin halving cycle: the lowest daily close came 542 days before the 2016 halving, 513 days before the 2020 halving and 516 days before the 2024 halving. Start counting near the floor and almost any ending looks good.
You can see it in the entry prices, too. Had you bought on a random day inside each window and held to the halving, you would have been in profit on 96% of the days in 2016’s window and 93% in 2024’s, but only on 64% of the days in 2020’s, when Bitcoin closed at $12,921 in June 2019 and was back under $9,000 by the halving.
Why Do Bitcoin Halvings Matter?
A halving cuts the number of new bitcoin paid to miners in half, every 210,000 blocks, roughly every four years. The next halving, at block 1,050,000, takes the reward from 3.125 to 1.5625 BTC per block.
Miners sell part of what they earn to pay for power and machines, so less new supply means less steady selling. The halving is known years ahead, though, and today’s issuance is small next to daily trading volume. Bitcoin’s price has also run on ETFs, interest rates and treasury companies this cycle, which weren’t part of the story in 2016.
The date isn’t fixed, either. A halving is set by block height, and the calendar date only follows from how fast blocks arrive. At the average pace since the April 2024 halving, about 596 seconds per block, block 1,050,000 arrives around April 8, 2028. That is the Bitcoin halving 2028 date most estimates use. If blocks keep coming as fast as they have this month, it moves up to mid-March, and the window would have opened in late September instead. Our halving countdown tool updates the estimate in your browser.
SIDE TRAIL: Bitcoin Cycles and the Halving: What Four Cycles of Data Actually Show
What Is Different Before the Bitcoin Halving 2028?
The starting point. The three earlier windows opened after Bitcoin had already crashed: 80% below its previous high in January 2015, 78% below it in November 2018 and 70% below it in November 2022.
This window opened at $84,093, about a third under the record close of $124,659 from October 6, 2025. Bitcoin’s deepest drop this cycle so far was to $57,800 on July 1, 2026, 54% under that record.
That leaves two readings. If July was this cycle’s floor, Bitcoin has already done its washing out, and the window opened higher off the bottom than usual. If it wasn’t, the bear market still has a leg to go, and the window may have opened near the top of its range rather than near the bottom, the opposite of the last three times.
The stat itself can’t tell you which. It only says what happened when the window happened to start near a floor.
Bitcoin Price Analysis: Where Does BTC Stand Inside the Window?
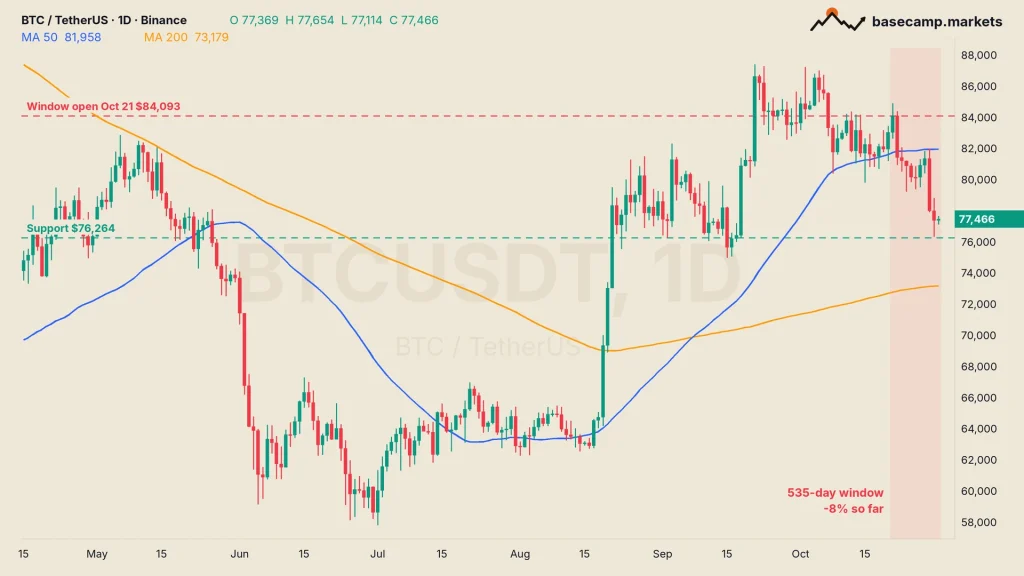
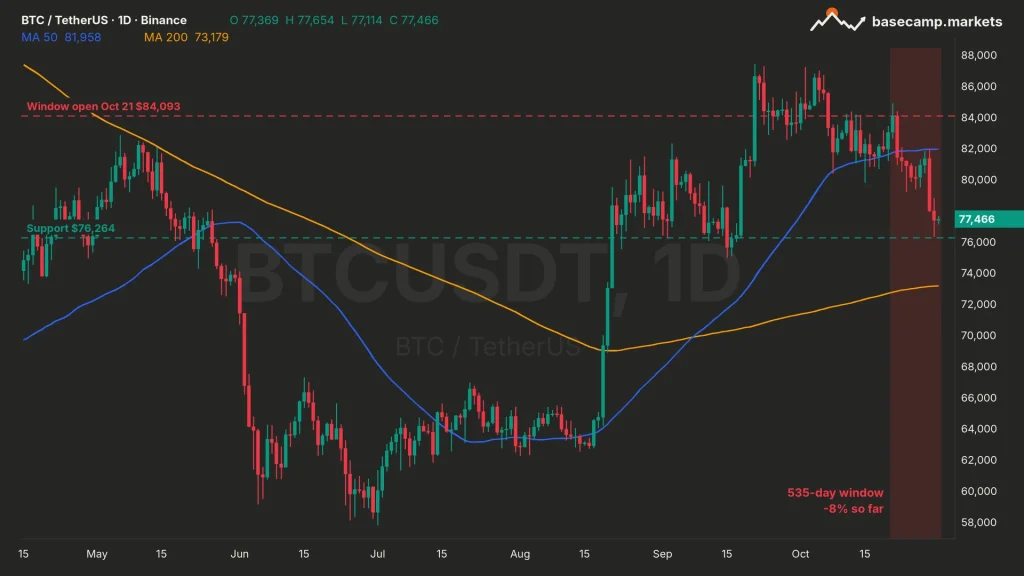
Bitcoin is 8% under the window’s opening price and below its 50-day moving average (MA), the average close of the last 50 days, at $81,958. The 200-day MA sits lower at $73,179.
The first level to watch is $76,264, the swing low that held this week. A daily close below it opens the way to the 200-day MA. To get back into the green for the window, Bitcoin needs to reclaim $84,093; it hasn’t closed a day above that level since October 21.
The halving is still about 525 days away. History says the window is far from decided at this point: in 2020, Bitcoin was down 27% a month in and still doubled by the halving.
TRAIL MAP: Bitcoin October 2026: BTC Heads for a Second Red October in a Row

In crypto since 2016. Trades the macro picture and reads the market on the high timeframes.
More from TheCryptoMonk →