
The short version
- Each candle shows four prices: open, high, low and close (OHLC).
- The body shows who won the period. The wicks show where price went and got rejected.
- A few patterns are worth knowing: long wicks, engulfing candles and dojis. Most of the hundreds you’ll read about aren’t.
- One candle means little on its own. Location and timeframe matter more than the shape.
Candlestick charts look like a barcode at first. Then one day it clicks, and you can glance at a chart and see a story: buyers pushed, sellers slapped them down, buyers came back.
This guide gets you to that click. You’ll learn how a single candle is built, what the long thin lines mean, and the handful of patterns worth your attention.
Anatomy of a candle
A candlestick packs four prices from one period (one hour, one day, whatever timeframe you chose) into a single bar:
- Open: the price when the period started.
- High: the highest price reached.
- Low: the lowest price reached.
- Close: the price when the period ended.
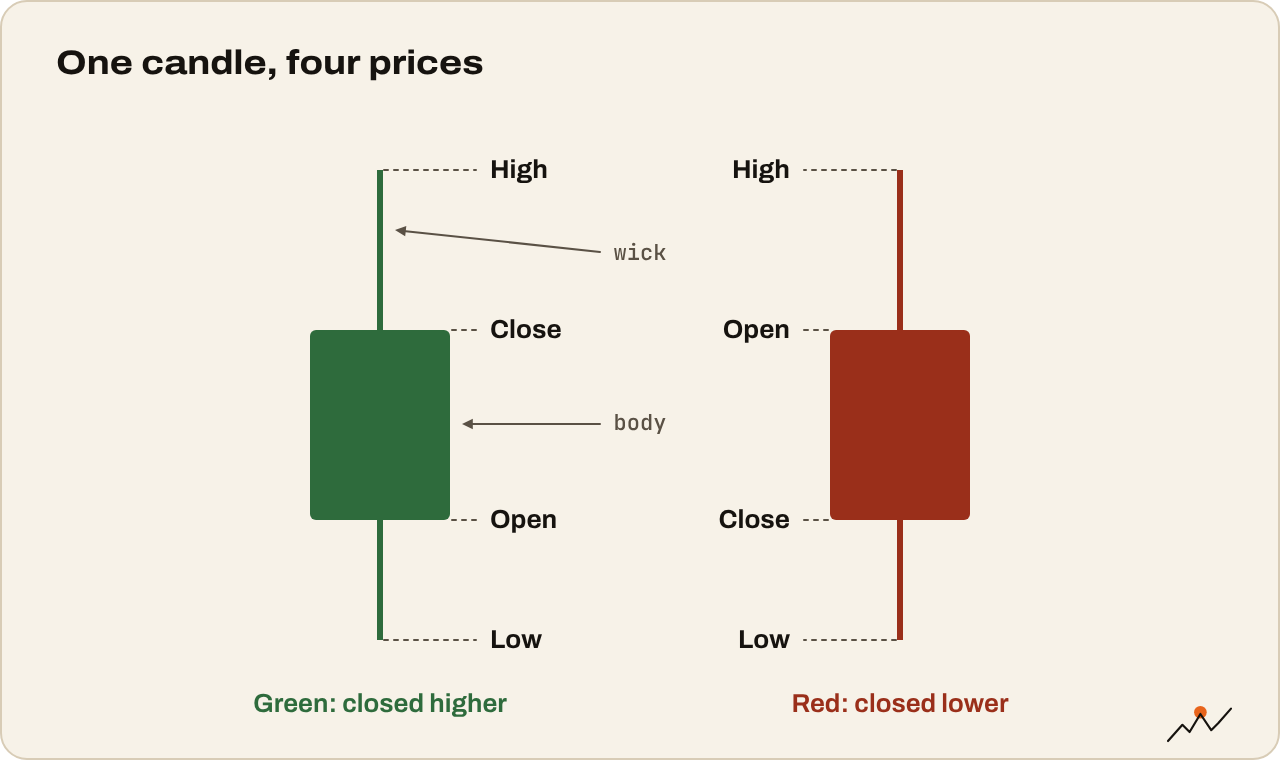
Traders call this OHLC. The candle draws it like this:
- The body (the thick part) runs from the open to the close.
- The wicks (also called shadows, the thin lines) stretch up to the high and down to the low.
- The color tells you the direction: green when the close is above the open, red when it’s below.
Example: Bitcoin opens the day at $80,000, drops to $78,500, rallies to $82,000 and closes at $81,200. That’s a green candle with a body from $80,000 to $81,200, a lower wick down to $78,500 and an upper wick up to $82,000.
Reading the body
The body shows who won the period and by how much.
- A big green body: buyers in control from open to close.
- A big red body: sellers in control.
- A tiny body: a draw. Price moved around but ended near where it started.
Compare a candle with the ones before it. A green candle twice the size of the last ten is a statement. One the same size as the rest is just another day.
Reading the wicks
Wicks are where the drama is. They show prices that were reached but couldn’t hold.
- A long lower wick: sellers pushed price down hard, then buyers stepped in and pushed it back up. That’s a rejection of lower prices.
- A long upper wick: buyers pushed up, sellers sold into it. A rejection of higher prices.
- Long wicks on both sides: a fight with no winner. Indecision.
In crypto, long wicks often come from liquidations: leveraged traders getting forced out in a quick spike, after which price snaps back. That’s why wicks into a key level are worth noticing.
Why the close matters most
During a candle, price can wander anywhere. The close is the price the market settled on when the period ended, so traders give it the most weight.
A coin that spikes above a big level and closes back below it hasn’t broken out. A coin that closes above it has at least made the first step. You’ll hear “wait for the daily close” a lot. Now you know why.
Patterns worth knowing
There are books listing more than a hundred candlestick patterns with Japanese names. You don’t need them. These five cover most of what matters:
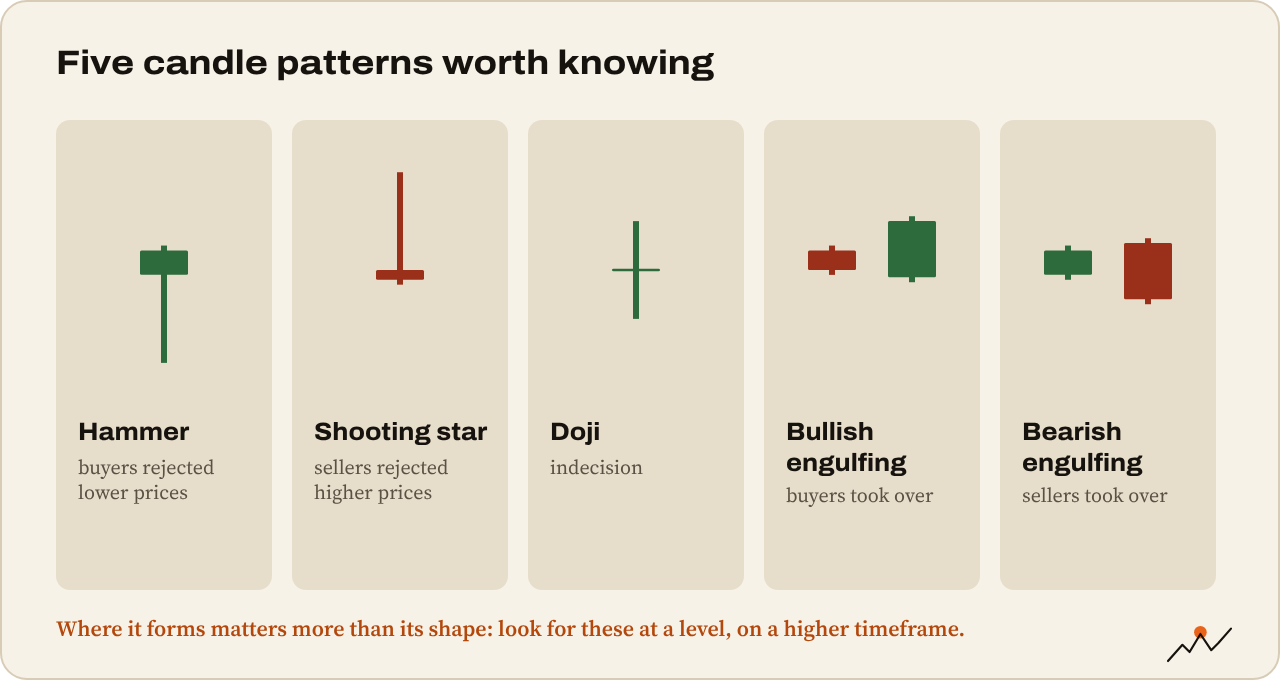
- Hammer: a small body near the top and a long lower wick, at least twice the body’s size. After a drop, it shows buyers rejecting lower prices.
- Shooting star: the opposite. A small body near the bottom and a long upper wick. After a rise, sellers rejected higher prices.
- Doji: open and close almost the same, so the body is a thin line. Indecision. Matters most after a strong run.
- Bullish engulfing: a green candle whose body completely covers the previous red body. Buyers took over.
- Bearish engulfing: a red body that completely covers the previous green body. Sellers took over.
Watch out. A pattern alone is not a signal. A hammer in the middle of nowhere means little. A hammer on the daily chart right at a level that held three times before means a lot more. Location first, shape second.
Timeframe changes everything
The same pattern means more on a higher timeframe. A shooting star on the 5-minute chart represents five minutes of trading. On the weekly chart, it’s a week of buyers failing.
And a small candle on a high timeframe can hide a lot. One daily candle with a long lower wick might be a full crash and recovery if you zoom into the hourly chart. Try it: find a daily candle with a big wick and switch to the 1h chart to watch it unfold.
Practice reading candles
- Open BTC/USD on the daily chart and find the biggest green and red bodies of the past month
- Find three long lower wicks. Where did they happen: near a previous low, or in the middle of nowhere?
- Find a doji after a strong move. What happened in the next few candles?
- Pick one daily candle and zoom to the 1h chart to see how it formed
Tip. CryptoCred’s Candlestick Charts is the first lesson of his free Technical Analysis Series and covers this in 25 minutes.
Where to go next
Candles show you what happened. Next, learn where they tend to stop and turn: Support and resistance in plain English.

On the climb since 2017. Trades futures and reads onchain data. Automates the boring parts.
More from VikingXBT →