
The short version
- Price alone tells you nothing. Market cap (price × circulating supply) is what a coin is really worth.
- A coin with trillions of tokens can’t reach $1 without becoming bigger than the world economy.
- FDV shows the value if every token that will ever exist were already out. A big gap to market cap means more supply is coming.
- Token unlocks add new supply, and new supply needs new buyers.
“It’s only a fraction of a cent. If it just goes to $1, I’m rich.” Almost everyone in crypto has had this thought, usually right before buying a coin with half a quadrillion tokens.
The price of one coin tells you almost nothing about whether it’s cheap or expensive. What matters is how many coins there are. This guide shows you the one bit of math that clears this up, and saves a lot of beginners a lot of money.
Price is only half the story
Think of a pizza. Cut it into 8 slices or 800, and the pizza is the same size. A slice of the 800-slice pizza is “cheaper,” but you’re getting a crumb.
Coins work the same way. Bitcoin has about 20 million coins. Some memecoins have hundreds of trillions. Comparing their prices is like comparing a slice to a crumb. To compare coins, you need the size of the whole pizza.
Market cap: the size of the pizza
Market cap (market capitalization) is:
Price × circulating supply = market cap
Circulating supply is the number of coins actually out there and tradable today.
Example with round numbers: Bitcoin at $80,000 × 20.1 million coins = about $1.6 trillion market cap. A coin at $0.50 with 1 billion tokens has a $500 million market cap. Bitcoin’s price is 160,000 times higher. Its market cap is about 3,200 times higher. Those are very different stories.
Market cap is what you compare when you ask “how big is this project?” and “how much room is there to grow?”
The “just has to reach $1” trap
Take a memecoin with around 589 trillion tokens in circulation, roughly the supply of Shiba Inu. For it to reach $1, its market cap would need to be $589 trillion.
For context, the entire world economy produces a bit over $110 trillion a year, and all the gold ever mined is worth tens of trillions. A $589 trillion memecoin isn’t a moonshot. It’s impossible.
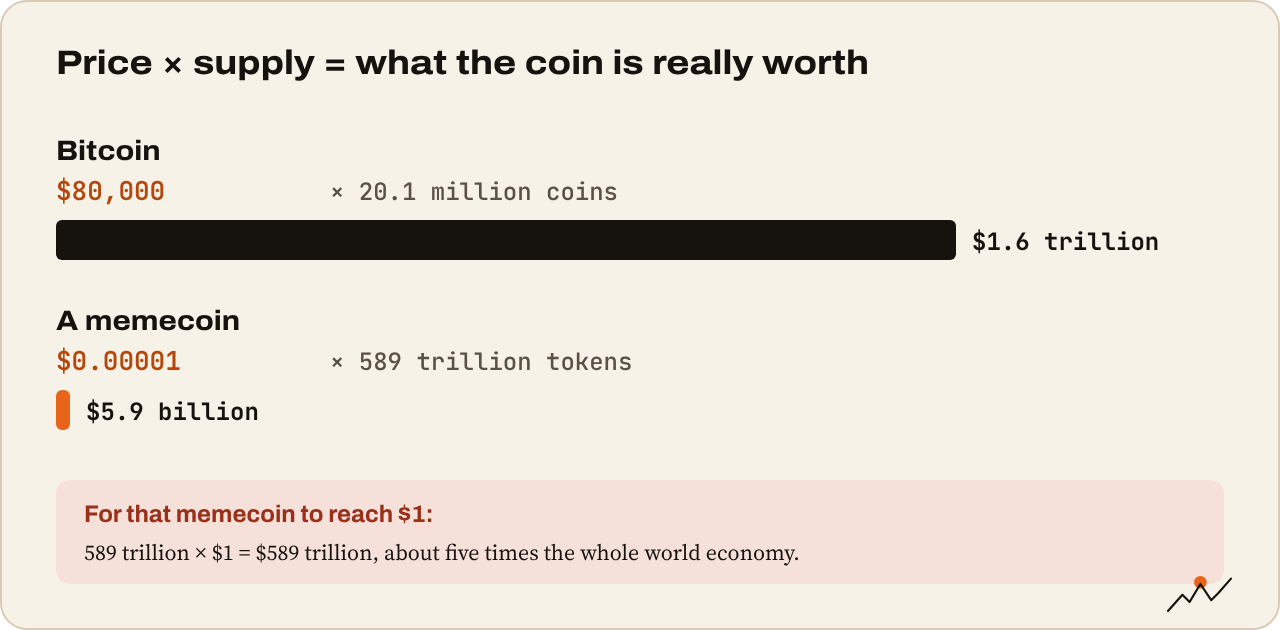
So before you dream about a price target, flip it into a market cap target. Our price target tool does it for you: enter a coin’s supply and a target price, and it shows the market cap that price needs.
Base Camp tool
Price target and market cap
What a 10x really means, and the market cap a coin would need to get there.
For learning only, not financial advice.
Circulating, total and max supply
Supply comes in three flavors, and the gap between them matters:
| Term | What it means |
|---|---|
| Circulating supply | Coins out there and tradable right now |
| Total supply | Coins created so far, including ones locked for the team or investors |
| Max supply | The most that can ever exist (some coins have no maximum) |
Bitcoin has a max supply of 21 million and about 20.1 million already circulating. Very little new supply is left to come. Ethereum has no max supply, but some fees are burned, so its supply grows only slowly or shrinks at times. Many newer tokens have only 10% to 30% of their supply circulating at launch.
FDV: the full pizza on the table
FDV (fully diluted valuation) is:
Price × max supply = FDV
It tells you what the project would be worth at today’s price if every token were already out.
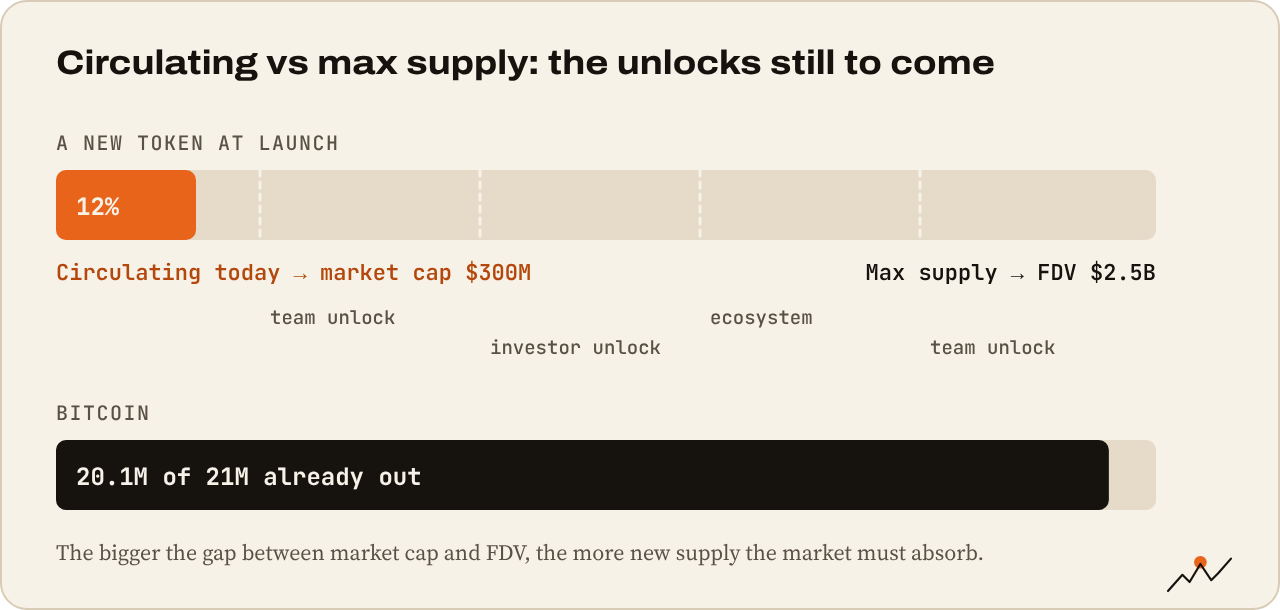
Why care? Imagine a new token with a $300 million market cap and a $3 billion FDV. Only 10% of its tokens are trading. The other 90% will reach the market over the next few years, mostly held by the team and early investors who paid far less than you. For the price to just stay flat, the market has to absorb ten times today’s supply.
A big gap between market cap and FDV is one of the clearest warning signs for a new token. It doesn’t mean the price must fall. It means a lot of new selling is scheduled.
Token unlocks
Locked tokens are released on a timetable called vesting. Each release is a token unlock. Unlocks are public, and sites like Tokenomist (formerly TokenUnlocks) and CoinGecko list upcoming dates.
Big unlocks often weigh on price, sometimes for weeks before the date, because traders know early holders may sell. Check the unlock calendar before buying any newer token.
Volume and liquidity
Two more numbers on every coin page:
- 24h volume: how much traded in a day. Low volume means even small sales can move price a lot.
- Liquidity: how much you can buy or sell without moving the price. A coin can show a big market cap but have so little liquidity that you can’t sell more than a few thousand dollars without crashing it.
A small market cap with almost no volume is a trap door. The price on the screen isn’t a price you can actually get.
Check this before you buy any coin
- What’s the market cap, and how does it compare with similar projects?
- What share of the max supply is circulating?
- How big is the gap between market cap and FDV?
- Are big token unlocks coming in the next months?
- Who holds the supply: is it spread out or held by a few wallets?
- Is daily volume healthy, or could I get stuck?
Tip. CoinGecko and CoinMarketCap show market cap, FDV, circulating and max supply on every coin page. For the full term list, see the Glossary under tokenomics.
Where to go next
You can now size up any coin. The last guide in First charts is the simplest strategy there is, and one of the hardest to beat: DCA: the simplest strategy.

On the climb since 2017. Trades futures and reads onchain data. Automates the boring parts.
More from VikingXBT →