
The short version
- An uptrend makes higher highs and higher lows. A downtrend makes lower highs and lower lows. Anything else is a range.
- The swing points that matter are the ones that caused a clear move, on the timeframe you trade.
- A break of structure confirms the trend. A change of character (the first broken higher low or lower high) warns it may be ending.
- Trade with the structure of the higher timeframe. Most losing trades fight it.
Indicators lag. News is noise. But price itself tells you a lot, if you know how to read the sequence of highs and lows it leaves behind. That sequence is called market structure, and it’s the backbone of almost every price action method you’ll ever learn.
The idea is simple enough to explain in one sentence. Using it well takes practice. This guide gives you both.
Swing highs and swing lows
Price never moves in a straight line. It goes up, pulls back, goes up again. Each turn leaves a point on the chart:
- A swing high is a peak: a high with lower highs on both sides.
- A swing low is a trough: a low with higher lows on both sides.
Join the swings and you see the zigzag that every trend is made of. Market structure is simply the study of how each swing compares with the one before.
Uptrends, downtrends and ranges
- Uptrend: each swing high is higher than the last (a higher high, HH) and each swing low is higher than the last (a higher low, HL). Buyers are winning. See higher highs and higher lows.
- Downtrend: lower highs (LH) and lower lows (LL). Sellers are winning.
- Range: highs and lows roughly level, or a mix with no clear direction. Neither side is winning. See range.
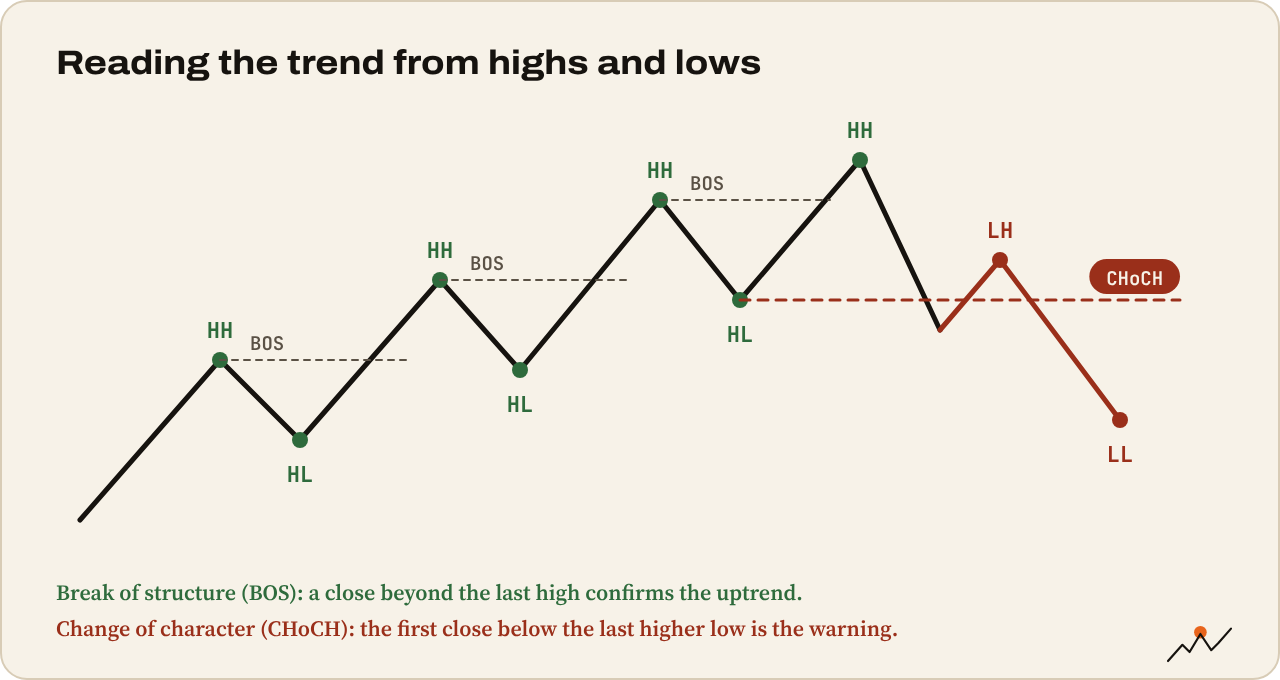
That’s it. Before any indicator, before any news, ask: what are the last two highs and the last two lows doing? The answer tells you which way the market is leaning.
Which swings count?
This is where beginners get stuck. Zoom into any chart and there are dozens of tiny swings. Which ones matter?
- The ones that caused a clear move. A swing low that launched a strong rally, or a swing high that started a sharp drop. If you have to squint to see it, skip it.
- The ones on your timeframe. A swing that matters on the 15-minute chart is invisible on the daily. Decide which timeframe defines your trend and read swings there.
- The ones confirmed by a close. A swing high is only “taken out” when price closes beyond it on your timeframe, not when a wick pokes through.
Two traders can disagree about minor swings. They should rarely disagree about the major ones. If they do, the market is probably in a range.
Break of structure: the trend continues
In an uptrend, each new close above the last swing high is a break of structure (BOS). It confirms buyers are still in control. In a downtrend, a close below the last swing low does the same for sellers.
A healthy trend keeps printing BOS after BOS, with pullbacks in between. The pullbacks are where trend traders look to join: buying a higher low in an uptrend, selling a lower high in a downtrend.
Change of character: the first warning
Trends end. The first sign is usually a change of character (CHoCH, sometimes called a market structure shift):
- In an uptrend, price closes below the last higher low. For the first time, a buyers’ swing has failed.
- In a downtrend, price closes above the last lower high.
A change of character doesn’t mean the trend has reversed. It means the old pattern has broken. Often price ranges for a while. A full reversal is confirmed when the new direction makes its own pattern: after a broken higher low, a lower high and then a lower low.
Tip. A useful habit: in a trend, always know which swing would “break” it. In an uptrend, that’s the last higher low. Mark it on the chart. If price closes below it, your bullish view needs updating.
Structure across timeframes
Structure on different timeframes can point different ways at the same time. Bitcoin can be in an uptrend on the weekly, a pullback (downtrend) on the 4h and a bounce (uptrend) on the 15-minute.
That’s normal, and it’s useful:
- The higher timeframe tells you the main direction.
- The lower timeframe shows you when a pullback in that direction is ending.
The classic setup: the daily is in an uptrend, the 4h has pulled back into a lower-high, lower-low sequence, and then the 4h breaks its last lower high. The small downtrend has ended inside the big uptrend. That’s a pullback finishing. We go deeper in Multi-timeframe analysis.
Using structure in your trading
- Trade with the higher-timeframe trend. Longs in uptrends, shorts in downtrends. Counter-trend trades are where most beginners lose money.
- Enter on pullbacks, not after big extended candles. A higher low in an uptrend gives a nearby, logical stop.
- Put stops beyond structure. Below the higher low for longs, above the lower high for shorts. If that level breaks, the reason for your trade is gone.
- Aim for the next structure point. The last swing high is a natural first target in an uptrend.
- In a range, switch mode. Either trade from the edges or wait. Breakout trades inside a range are mostly fakeouts.
Watch out. Crypto loves to poke just past an obvious swing high or low, trigger the stops sitting there, and reverse. A wick past a swing isn’t a break; a close is. We cover this behavior in the Summit guide on liquidity sweeps and deviations.
Practice on a real chart
- Open BTC/USD on the daily chart and mark the last four swing highs and lows
- Label each one HH, HL, LH or LL. What’s the trend?
- Find the last break of structure and the last change of character
- Mark the swing that would break the current trend if price closed beyond it
- Switch to the 4h chart. Does the structure agree with the daily?
Tip. CryptoCred’s Market Structure is the classic long-form lesson. Trader Mayne’s How To Trade Market Structure Like a Pro is a good, more recent follow-up.
Where to go next
Structure tells you the trend. Next, the tools that frame it: Trendlines, ranges and breakouts.

On the climb since 2017. Trades futures and reads onchain data. Automates the boring parts.
More from VikingXBT →