
The short version
- Liquidity is resting orders: stops and breakout entries clustered above swing highs and below swing lows. Big players need it to fill size.
- A sweep is a quick run through that liquidity followed by a reversal. On a range, it’s called a deviation.
- The trade isn’t the sweep. It’s the reclaim: price closing back inside, with a stop beyond the sweep’s extreme.
- Not every run of a high is a sweep. In strong trends, liquidity gets taken and price keeps going. Context decides.
You place a stop just under an obvious low. Price wicks through it by a few dollars, takes you out, and rips higher without you. Do that a few times and it feels personal.
It isn’t personal. It’s structural. Your stop was part of a pool of orders that larger traders needed in order to buy. Once you understand where that liquidity sits and why price is drawn to it, those painful wicks turn into some of the clearest setups on the chart. This guide builds on Market structure and Trendlines, ranges and breakouts.
What “liquidity” means on a chart
In trading, liquidity means orders available to trade against. A big buyer can’t buy 2,000 BTC with a single click without moving price badly. They need sellers, in size, at a price.
Where are lots of sell orders sitting? Under obvious lows. That’s where longs keep their stop-losses (which are sell orders) and where breakout traders place sell-stop entries to short a breakdown. Above obvious highs it’s the reverse: shorts’ stops and breakout buy entries.
So the most visible levels on a chart are also the places with the most resting orders:
- Equal highs and equal lows (“double tops and bottoms”): textbook stop locations.
- Swing highs and lows on the daily and 4h.
- Range highs and lows.
- Trendlines with several touches: stops pile up just beyond the line.
- Round numbers and the previous day’s or week’s high and low.
Traders call these pools “buy-side liquidity” (above highs) and “sell-side liquidity” (below lows).
Why price is drawn to it
Think about the big buyer again. If they want to buy a lot at a good price, the best place is where many people are forced to sell: just below an obvious low, where the stops sit. When price dips there, the stops trigger, a wave of market sell orders hits the book, and the big buyer fills against them.
In crypto there’s an extra engine: liquidations. Leveraged longs have liquidation prices below the lows; leveraged shorts above the highs. A move into those clusters triggers forced orders that push price further, until the fuel runs out. Liquidation heatmaps estimate where those clusters sit (see Reading order books, funding and open interest together).
None of this needs a conspiracy. It’s just where the orders are.
The liquidity sweep
A liquidity sweep (or “stop run”) is a quick move through a pool of liquidity that fails to hold and reverses.
Anatomy of a bullish sweep:
- A clear swing low or equal lows, with stops beneath.
- Price trades below it, triggering the stops. Volume and liquidations spike.
- Sellers run out. Price closes back above the low, often within the same candle or the next one.
- The candle leaves a long lower wick below the level.
A bearish sweep is the mirror image above highs.
The swing failure pattern
A clean, rules-based version of the sweep is the swing failure pattern (SFP):
- Bearish SFP: price trades above a prior swing high but the candle closes below that high.
- Bullish SFP: price trades below a prior swing low but the candle closes above it.
The close is everything. A wick above the high that closes above it is a breakout. A wick above the high that closes back below is a failure. The higher the timeframe and the more obvious the swing that was swept, the more weight the SFP carries.
Deviations from a range
On a range, a sweep has its own name: a deviation. Price breaks out of the range, fails to hold, and closes back inside.
Why deviations are powerful:
- Everyone who bought the breakout is now trapped and needs to sell.
- Stops of the range shorts above the high have already been used up.
- The obvious target is the other side: first the range midpoint, then the opposite edge.
A deviation above the range high that closes back inside is one of the most reliable setups in crypto for a move back to the midpoint. A deviation below the range low that reclaims it does the same upwards.
How to trade a sweep or deviation
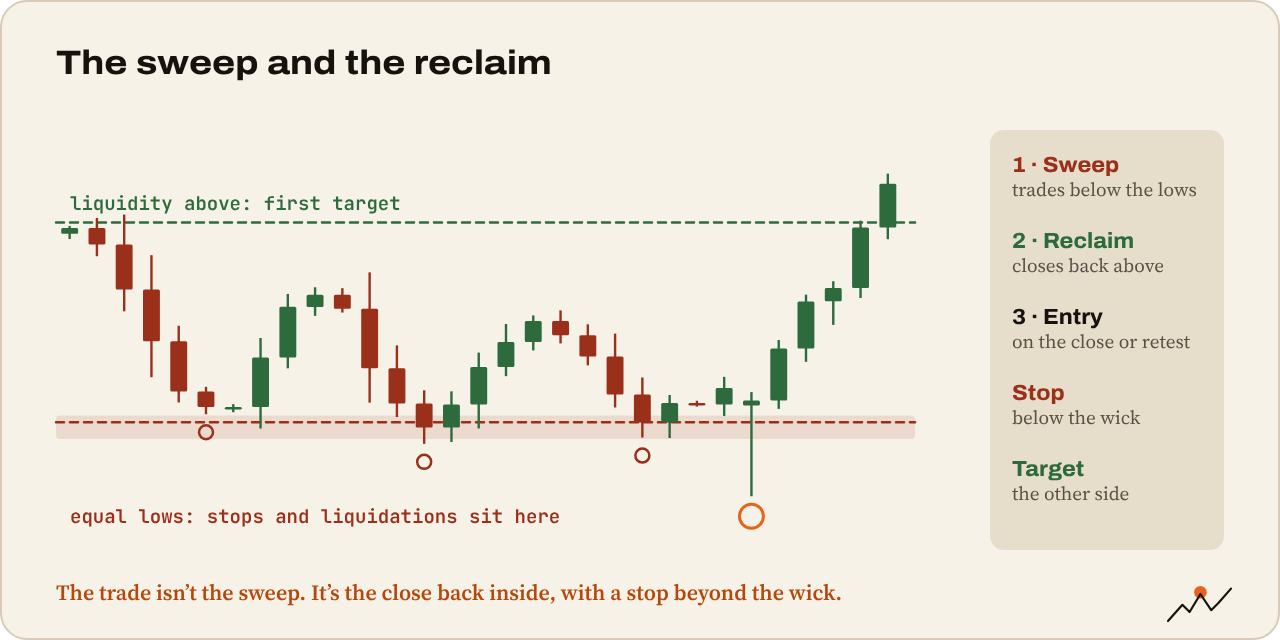
- Mark the liquidity in advance. Which highs and lows are obvious? Where are the equal highs, the range edges, the previous week’s high?
- Wait for the sweep. Price must actually trade through the level. Anticipating a sweep that never comes is how you get run over.
- Wait for the reclaim. The candle closes back on the right side of the level, on your timeframe. For extra confirmation, a lower timeframe change of character in the new direction.
- Entry: on the reclaim close, or on a retest of the swept level from the inside.
- Stop: beyond the extreme of the sweep wick. If price makes a new extreme, the idea is wrong.
- Targets: the range midpoint, then the opposite liquidity pool. Opposite liquidity is often the next magnet.
Because the stop sits just beyond a fresh extreme, these setups often give excellent risk/reward of 1:3 or more.
Tip. The best sweeps come with confluence: a higher-timeframe level, funding flipping against the move, a spike in liquidations and open interest dropping sharply. That combination says the move was forced, not chosen.
When it isn’t a sweep
Here’s the part that gets skipped in most “smart money” videos. In a strong trend, liquidity gets taken and price keeps going. That’s not a failed sweep; that’s a breakout using the liquidity as fuel.
Signs you’re looking at continuation, not a sweep:
- The candle closes beyond the level and the next one follows through.
- The move is in the direction of the higher-timeframe trend.
- Volume stays high after the break instead of fading.
- The level that was “swept” was minor, on a lower timeframe than you trade.
Sweeps against the higher-timeframe trend at minor levels are the weakest setups. Sweeps of major levels in the direction of the higher-timeframe trend, after a pullback, are the strongest.
Stop being the liquidity
The same idea helps your own stop placement:
- Don’t put your stop exactly at the obvious low. Everybody else did too. Put it beyond the zone, with room for a sweep, and size the position smaller to keep risk at 1R. CryptoCred calls this the overthrow.
- Avoid entering breakouts of obvious levels on thin volume. You may be the one getting trapped.
- After your stop is swept and price reclaims, it’s fine to re-enter if the setup is still valid. Have a rule for it in your trade plan.
Watch out. Hindsight makes every wick look like an obvious sweep. In real time, many sweeps keep going. Always trade the reclaim, never the anticipation, and always keep a stop beyond the extreme.
Practice on your charts
- Mark the obvious liquidity on the BTC 4h chart: equal highs, equal lows, range edges, last week’s high and low
- Find three swing failure patterns on the daily chart. Where did price go next?
- Find a range deviation and measure whether price reached the midpoint and the opposite edge
- Find a sweep that failed (price kept going). What was different about the context?
Tip. Trader Mayne’s How I View Liquidity Sweeps, Swing Failures, And Deviations covers this in under five minutes. His How I’d Learn To Trade Liquidity If I Started Over is the long version.
Where to go next
Sweeps read best when you know which timeframe is in charge. Next: Multi-timeframe analysis.
