
The short version
- Use three timeframes, each about four to six times the next: one for direction, one for setups, one for entries.
- Work top-down: the higher timeframe sets bias and key levels; lower timeframes only time the entry.
- The best trades happen when a lower-timeframe pullback ends in the direction of the higher-timeframe trend, at a higher-timeframe level.
- When timeframes conflict, trade smaller, trade the range, or don’t trade. Never let a 5-minute chart overrule the daily.
Every trader has done this. You see a perfect long on the 15-minute chart, take it, and get stopped out. Then you zoom out and find price was sitting right under weekly resistance in a daily downtrend. The 15-minute setup was fine. It was just a small wave crashing into a big one.
Multi-timeframe analysis (MTFA) fixes that. It’s a routine for reading the market from the top down, so that every entry fits inside the bigger picture instead of fighting it.
Why one timeframe isn’t enough
Each timeframe is a different zoom level of the same market. A trend on the 1h is often just a pullback on the daily. A breakout on the 15-minute can be a sweep on the 4h.
Higher timeframes carry more weight because more money and more time stand behind each candle. A weekly level reflects months of positioning. A 5-minute level reflects a few minutes. When they disagree, the higher one usually wins.
But higher timeframes are bad for entries: stops are wide and setups are rare. That’s why you combine them.
Choosing your stack
Pick three timeframes, each roughly four to six times the one below:
| Style | Direction | Setup | Entry |
|---|---|---|---|
| Position trading | Monthly / weekly | Weekly | Daily |
| Swing trading | Weekly / daily | 4h | 1h |
| Day trading | Daily / 4h | 1h | 15m |
| Scalping | 1h | 15m | 1m–5m |
Choose the stack that fits your life. Swing trading on the daily, 4h and 1h works around a full-time job. Day trading needs hours of screen time. Whatever you pick, write it in your trade plan and stick to it. Hopping timeframes until one agrees with you is confirmation bias with extra steps.
Step 1: The direction timeframe
Start at the top and answer three questions:
- What’s the structure? Higher highs and higher lows, lower highs and lower lows, or a range? (See Market structure.)
- Where are the key levels? Major support and resistance, range edges, big swing points, the 200-day or 200-week moving average.
- Where is price now? Near support, near resistance, or in the middle?
That gives you a bias: long, short or neutral. Price at weekly support in a weekly uptrend? Strong long bias. Price under weekly resistance after a long rally? Long bias, but not here. Middle of a range? Neutral.
Mark the higher-timeframe levels on your chart so they stay visible when you zoom in.
Step 2: The setup timeframe
Now zoom in one level and look for a setup that fits the bias:
- In a higher-timeframe uptrend, you want a pullback on the setup timeframe that reaches a higher-timeframe level, then shows signs of ending.
- In a higher-timeframe range, you want price to reach one of the edges, ideally with a deviation.
- In a higher-timeframe downtrend, the mirror image: a rally into resistance that stalls.
The setup timeframe is also where you plan your stop and targets. The stop sits beyond the setup’s structure; the targets are the next levels from the higher timeframe.
Step 3: The entry timeframe
Only now do you look at the lowest timeframe, and only to time the entry. You want the small trend to turn in the direction of the big one:
- In a daily uptrend, while the 4h pulls back, wait for the 1h to break its last lower high. The pullback has ended in your direction.
- Or wait for a reclaim of the level after a sweep.
The entry timeframe lets you use a tighter stop (beyond the lower-timeframe swing) while still trading the higher-timeframe idea. That’s how MTFA improves risk/reward: the same target, a closer stop.
Tip. The entry timeframe never changes the bias. If the 15-minute looks bearish while you have a daily long bias, that’s not a short signal. It’s a “not yet.”
A worked example
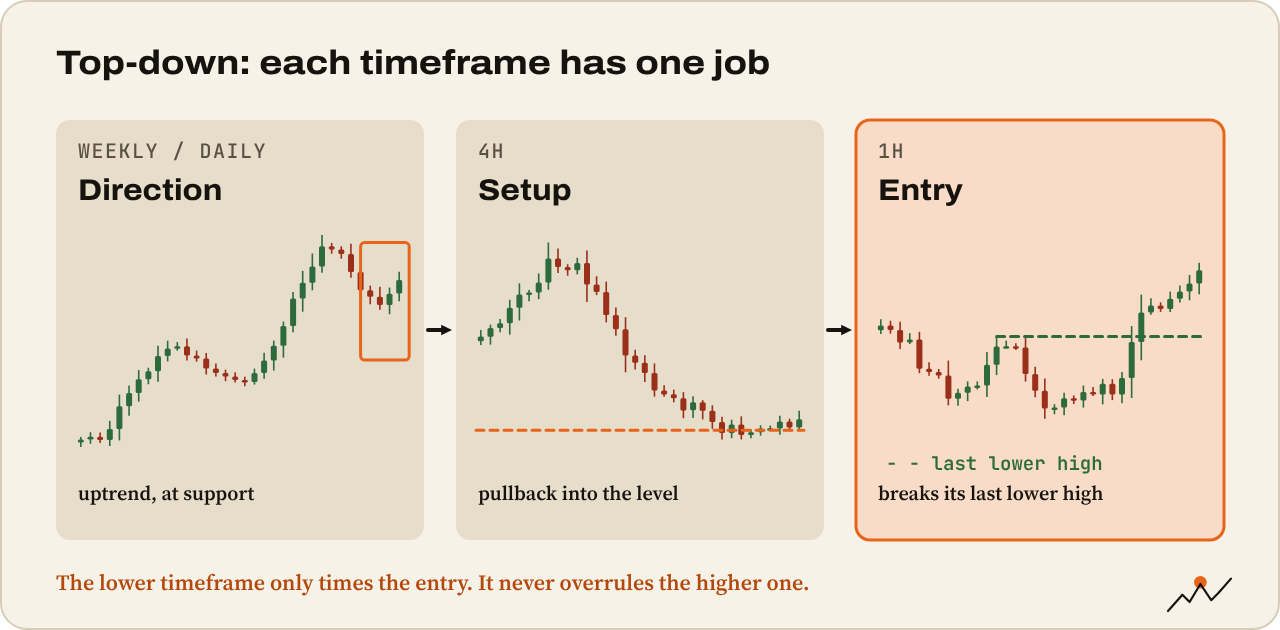
Swing trading Bitcoin with weekly/daily, 4h and 1h:
- Weekly and daily: higher highs and higher lows. Price above a rising 200-day moving average. Last daily breakout level at $78,000, now likely support. Bias: long.
- 4h: price has pulled back from $84,000 in a sequence of lower highs, reaching $78,200, right at the daily level. RSI on the 4h has reset to the 40s.
- 1h: price sweeps below $78,000 to $77,400, closes back above it, then breaks the last 1h lower high at $78,900.
- Trade: enter at $78,900. Stop below the sweep at $77,200 (2.2% risk). First target: the $84,000 high (6.5% away), roughly 1:3.
Every timeframe agreed. That’s the trade you wait for.
When timeframes conflict
Often they won’t agree. Options:
- Trade the range: if the daily is neutral, trade the setup timeframe’s range edges with smaller targets.
- Size down: a counter-trend trade on a lower timeframe gets half your normal risk, a close target and a fast exit.
- Do nothing. Many of the best traders spend most of their time waiting. Conflicting timeframes are a perfectly good reason to sit out.
What not to do: take a long because the 5-minute looks great while the daily is breaking down. The bigger trend doesn’t care about your entry.
A top-down routine
- Weekly: structure, key levels, where price sits. Bias written down
- Daily: same three questions. Does it agree with the weekly?
- Setup timeframe: is there a pullback or range edge at a higher-timeframe level?
- Entry timeframe: has the small trend turned in the direction of the bias?
- Stop beyond the setup’s structure; targets at the next higher-timeframe levels
- Risk/reward at least 1:2 to the first target
- If timeframes conflict: smaller size, or no trade
Common mistakes
- Too many timeframes. Six charts give you six opinions. Three is enough.
- Starting at the bottom. Opening the 5-minute first and then hunting for higher-timeframe reasons to justify it.
- Treating every timeframe equally. The higher timeframe sets the bias; the lower ones don’t vote on it.
- Ignoring the daily close. Candle closes on the higher timeframe often decide whether a setup is still valid.
Tip. CryptoCred’s Top Down Approach to Trading and Market Microstructure go deeper into structure inside structure.
Where to go next
Charts show you price. The next guide adds the data underneath it: Reading order books, funding and open interest together.
