
The short version
- Altcoin season is a stretch when most altcoins beat Bitcoin, not just rise with it. The usual test: 75% of the top coins outperforming BTC over 90 days.
- The classic rotation runs Bitcoin → Ethereum → large caps → small caps → memecoins, with BTC dominance falling along the way.
- 2017 and early 2021 had broad altseasons. 2024–25 didn’t: ETF money stayed in Bitcoin and new token supply soaked up the rest.
- Judge altcoins against BTC, not the dollar. If an alt can’t beat Bitcoin, holding it is extra risk for less reward.
“Altseason is coming” is probably the most repeated sentence in crypto. In 2017 and early 2021 it came, and small coins went up 10x, 50x, 100x in months. Since then a lot of traders have been waiting for a repeat that, for most altcoins, never arrived.
This guide explains how altcoin seasons have worked, how to measure them, and why the structure of the market has changed. It builds on Bitcoin cycles and the halving and On-chain metrics that matter.
What altseason actually means
An altseason isn’t altcoins going up. They go up in any bull market. It’s altcoins going up more than Bitcoin, broadly, for weeks or months.
The common definition, used by the Altcoin Season Index from Blockchaincenter and a similar one on CoinMarketCap: at least 75% of the top 50 to 100 coins (excluding stablecoins) outperform Bitcoin over the past 90 days. Below 25% is “Bitcoin season.” In between is a mixed market.
In early October 2026, CoinMarketCap’s version jumped to 61, from 23 a month earlier. Rising, not there.
BTC dominance
Bitcoin dominance (BTC.D on TradingView) is Bitcoin’s share of the total crypto market cap. It’s the simplest gauge of rotation:
- Dominance rising: money favors Bitcoin. Altcoins underperform, even if they rise in dollars.
- Dominance falling while the total market rises: money is rotating into altcoins. That’s the altseason signature.
- Dominance rising while the market falls: a flight to safety. Alts fall harder.
For context: dominance collapsed from about 70% to around 40% in the first months of 2021, during that cycle’s altseason. In January 2018 it briefly fell to about a third. In October 2026 it was hovering around 58% to 60%.
Two catches: stablecoins are part of the total, so dominance can fall just because stablecoin supply grows; and every new token with a big headline market cap dilutes it. Look at variants that exclude stablecoins where you can.
The rotation, step by step
In past cycles money moved down the risk curve in a fairly consistent order:
- Bitcoin leads. New money and institutions buy BTC first. Dominance rises.
- Ethereum catches up. ETH/BTC starts rising. Often the first real sign of rotation.
- Large caps follow: SOL, BNB, XRP and other top-20 coins outperform.
- Mid and small caps run. Sector narratives take turns: DeFi, gaming, AI, real-world assets.
- Memecoins and new launches go parabolic. Retail arrives late and buys the riskiest stuff. Often near the end.
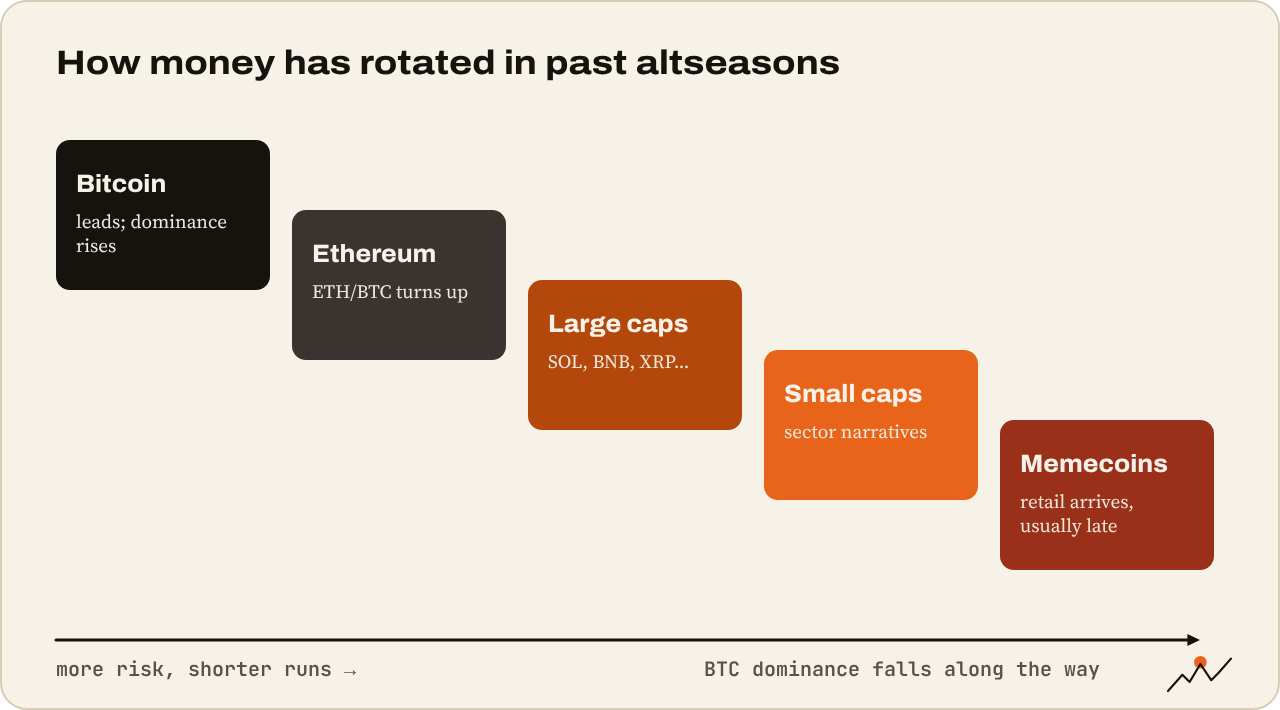
Each step is riskier and usually shorter than the last. By the time your relatives ask which memecoin to buy, the rotation is usually late.
The charts to watch
| Chart (TradingView) | What it tells you |
|---|---|
| BTC.D | Bitcoin’s share of the market |
| ETHBTC | Whether Ethereum is gaining on Bitcoin; often the first domino |
| TOTAL2 | Total market cap excluding BTC |
| TOTAL3 | Excluding BTC and ETH: the broad altcoin market |
| OTHERS.D | Dominance of coins outside the top 10 |
| [Coin]/BTC | Whether a specific alt is beating Bitcoin |
The cleanest altseason signal is a combination: TOTAL3 breaking out to new highs, BTC.D breaking down from a range, and ETH/BTC trending up. One without the others is often a short-lived rotation.
Why 2024–25 broke the playbook
Bitcoin went from about $40,000 at the start of 2024 to an all-time high of $126,000 in October 2025. Ethereum made a new high above $4,900 only in August 2025, far later and with a far smaller gain. Most altcoins never got near their 2021 highs. Why?
- ETFs pulled money into Bitcoin. Institutional buyers came through spot BTC (and later ETH) ETFs. That money doesn’t rotate into small caps.
- Supply exploded. Thousands of new tokens launched with low circulating supply and huge FDVs. Token unlocks from VC-backed projects meant steady selling. Memecoin launchpads created millions more. Money spread over far more coins.
- Attention split. Retail speculation went to memecoins on Solana and other chains, which rose and crashed in days rather than lifting the whole altcoin market.
- Digital asset treasury companies bought BTC, and later ETH and a few others, concentrating flows further.
The result was selective rotation: short, sharp runs in specific coins or sectors, rather than a tide lifting everything. The altseason index touched high levels briefly a few times, but nothing like 2017 or 2021.
Measuring alts against Bitcoin
The key habit at this level: price every altcoin in BTC as well as in dollars. An alt up 40% while Bitcoin is up 60% is a loss in real terms. You took more risk for less return.
Off the June 2026 lows, using daily closes, Bitcoin rose about 40% to October 19 (from $58,625 to $81,938), Ethereum about 54% (from $1,568 to $2,408) and Solana about 69% (from $62.20 to $105). That’s the shape of an early rotation: majors beating BTC off a low. Whether it widens into small caps is what TOTAL3 and OTHERS.D will show.
How to trade rotation
- Use BTC pairs for strength. Trade the alts making higher highs against BTC, not the ones that have “fallen the most.” Coins down 90% often keep falling.
- Follow the order. Before small caps, you want ETH/BTC and large caps to lead. Jumping to the end of the rotation is jumping to the riskiest part.
- Check supply. Before buying an alt, look at circulating vs total supply, upcoming unlocks and FDV. See Market cap, supply and why “cheap” coins aren’t cheap.
- Size for the downside. Alts fall 70% to 90% in bear markets. A position that would be fine in BTC can be deadly in a small cap.
- Take profit into strength. In past altseasons, gains disappeared faster than they came. Rotating profit back into BTC or stablecoins near euphoric conditions has been a better habit than holding for “one more leg.”
Watch out. Altseason narratives are a favorite of paid groups and influencers with bags to sell. If someone is certain it starts next week, ask what they hold. Let BTC.D, ETH/BTC and TOTAL3 tell you, not the timeline.
Altseason checklist
- Is BTC.D falling while the total market rises?
- Is ETH/BTC trending up?
- Is TOTAL3 breaking to new highs?
- What does the altcoin season index say, and is it rising?
- Is the alt I want beating BTC on its BTC pair?
- What are its circulating supply, FDV and next unlocks?
- How much would I lose if it fell 80%?
Where to go next
You’ve seen how markets move. Now build your own way to trade them, and test it before you risk money: Building and backtesting your own system.

On the climb since 2017. Trades futures and reads onchain data. Automates the boring parts.
More from VikingXBT →