
The short version
- A system is a set of rules precise enough that two people (or a computer) would take the same trades.
- Backtest it on years of data, including bear markets, with realistic fees and slippage. Judge it by expectancy, drawdown and number of trades, not by return alone.
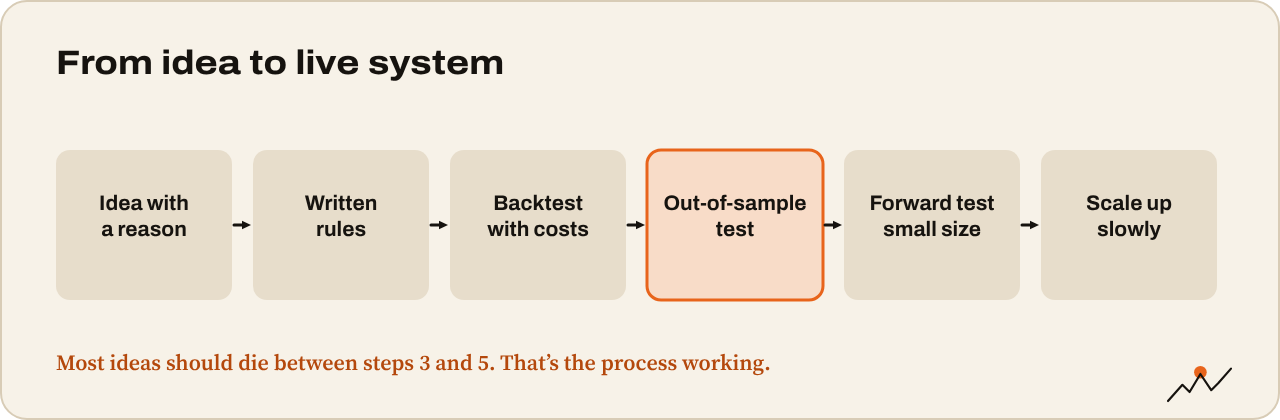
- The biggest danger is overfitting: tuning rules until they fit the past perfectly and fail in the future. Keep rules few and test on data you didn’t tune on.
- Then forward test with small size. A system you can’t follow through its worst drawdown is not your system.
Discretionary trading, reading the chart and deciding, can work. But it’s hard to know whether your results come from skill, luck or one good month. A system answers that question. You write rules, test them on data, and see whether they make money before you trust them with yours.
This is how professional traders work, and since 2024 it has never been easier for anyone to do. TradingView, Python and even AI coding assistants put real backtesting within reach. The hard part isn’t the software. It’s not fooling yourself.
What a trading system is
A system turns a setup into rules with no room for interpretation. It needs:
- Market and timeframe: e.g. BTC/USDT, 4h candles.
- Filter: when to trade at all, e.g. only when the daily close is above the 200-day moving average.
- Entry: the exact condition, e.g. a 4h candle closes back above the 20 EMA after closing below it.
- Stop-loss: e.g. below the lowest low of the last 5 candles.
- Exit: a target, a trailing stop or an opposite signal.
- Position sizing: e.g. risk 1% of equity per trade, as in Risk management.
- Costs: fees, slippage and, for perps, funding.
Test your rules by writing them down and asking: could a stranger trade this exactly as I would? If not, the rules aren’t finished.
Start from an idea with a reason
Good systems usually start from a reason the edge should exist, not from scanning thousands of indicator combinations. Ideas with logic behind them:
- Trend following: crypto trends hard. Buying strength and riding it with a trailing stop has a long track record across markets.
- Mean reversion inside ranges: fading moves to range edges when the higher timeframe is flat.
- Failed breakouts: trading the reclaim after a sweep.
- Funding and positioning extremes: fading crowded trades, as covered in Funding rates and open interest.
If you can’t explain why a pattern should keep working, assume it was luck.
Backtesting, step by step
1. Get clean data. Exchange candle data (Binance, Bybit, Coinbase) is free. Use the market you’ll actually trade. Include bull, bear and sideways years: for crypto, at least 2018 to today if the coin existed.
2. Choose a method:
- Manual (bar replay): TradingView’s replay mode lets you step through history candle by candle and log trades in a spreadsheet. Slow, but it trains your eye and works on an iPad.
- TradingView Pine Script: the built-in Strategy Tester runs coded rules over history and reports results. Good for simple systems.
- Python: libraries like pandas plus a backtesting framework give full control. AI assistants can help write the code; you must still check every rule it implements.
3. Add realistic costs. Use your real fee tier for each side, add slippage (more for small coins and market orders), and include funding for perps held over funding times. Plenty of systems that look great before costs lose money after them.
4. Avoid look-ahead bias. The test must only use information available at the time. Classic mistakes: entering on a candle’s close but at its open price, using indicators that repaint, or using a full day’s high to decide something at noon.
5. Run it and log every trade.
Reading the results
Don’t look at total return first. Look at:
| Metric | What it tells you | What to look for |
|---|---|---|
| Number of trades | Whether results mean anything | At least 100, ideally several hundred |
| Win rate and average R | How it makes money | Consistent with the idea (trend systems win less, earn more per win) |
| Expectancy | Average result per trade in R | Clearly positive after costs |
| Profit factor | Gross profit ÷ gross loss | Above about 1.3 after costs is interesting; above 3 often means something is wrong |
| Max drawdown | Worst peak-to-trough fall | One you could really live through |
| Longest losing streak | The psychological test | Expect worse in live trading |
| Results by year | Whether it only worked once | Positive or flat in most years, not one big year |
Compare against a benchmark: just holding BTC, or a simple DCA. If your system can’t beat holding after costs and with similar risk, the honest answer is to hold.
Overfitting: the trap that ruins most systems
Overfitting is tuning a system until it fits the past perfectly. It has so many rules and fine-tuned settings that it has memorized history instead of finding an edge. It looks magnificent in the backtest and fails live.
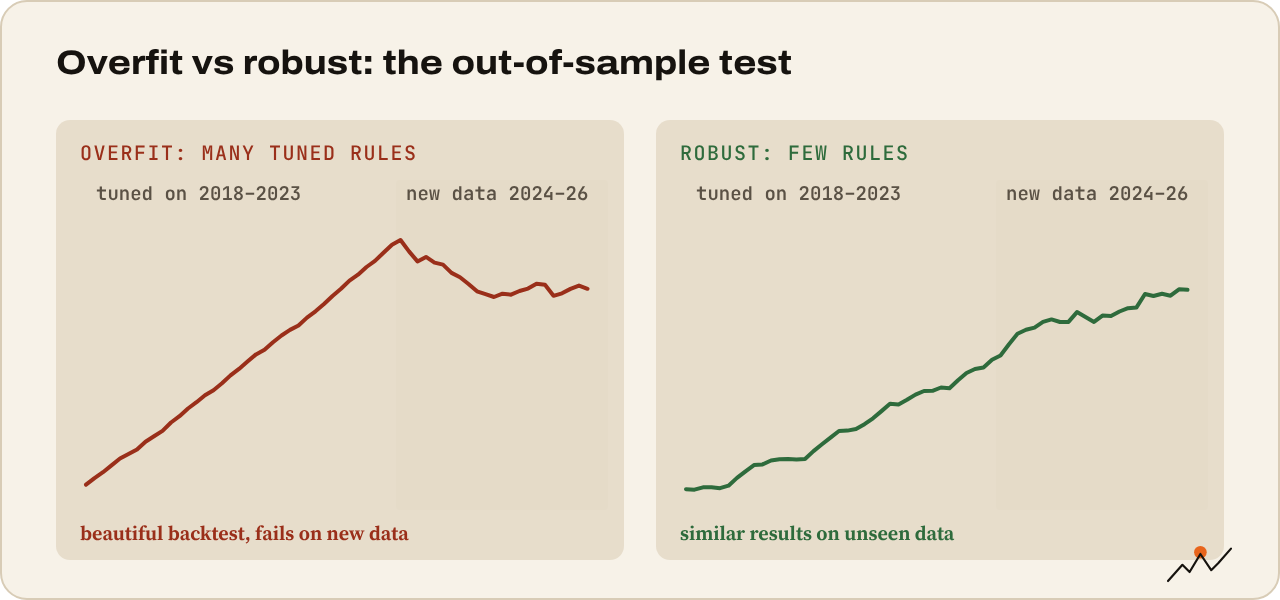
Warning signs:
- Results collapse if you change a setting slightly (EMA 21 works, 20 and 22 don’t).
- Many rules, each added to fix a specific losing trade.
- A huge share of profit comes from a handful of trades or one year.
- It only works on one coin and one timeframe.
Defences:
- Few rules and few parameters. Three to five rules is plenty.
- Robustness checks: nearby settings should give similar results. Try other coins and timeframes; a real edge usually shows up, weaker, elsewhere.
- Out-of-sample testing: build and tune the system on, say, 2018–2023, then test it once on 2024–2026 without changing anything. If it falls apart, it was fitted.
- Walk-forward testing: repeat that process in rolling windows (tune on years 1–3, test on year 4, roll forward), which mimics how you’d use it live.
- Monte Carlo: shuffle the order of trades thousands of times to see the range of drawdowns you could face. The backtest’s drawdown is one path; the real one may be worse.
Watch out. The more ideas you test, the more likely one looks great by chance. If you tried 50 variations and kept the best, assume its results are inflated. Out-of-sample data you never touched is the only honest judge.
Forward testing
A clean backtest earns the system a trial, not your full account:
- Paper trade or trade tiny size for at least 30 to 50 trades or a few months. See paper trading.
- Compare live results with the backtest: slippage, fills, missed trades, your own discipline.
- Scale up slowly if live results sit within the range the backtest predicted.
- Define a kill switch in advance: e.g. if drawdown exceeds 1.5 times the worst backtested drawdown, stop and review.
Automation
Once rules are tested, they can run automatically: exchange APIs, TradingView alerts sent to an exchange, or a bot. Automation removes hesitation and emotion, but adds new risks: bugs, API outages, exchange errors, and a bot doing something stupid at 4 a.m. Start with alerts you act on by hand, then automate the parts that are proven. Never give a bot API keys with withdrawal permission.
Your system checklist
- Rules written so a stranger would take the same trades
- A reason the edge should exist
- Tested over bull, bear and sideways years, with fees, slippage and funding
- At least 100 trades, positive expectancy, a drawdown I can live with
- Robust to small parameter changes and works (weaker) on other markets
- Out-of-sample or walk-forward tested
- Forward tested with small size before scaling
- A kill switch defined in advance
Tip. For a complete example of rules-based thinking, CryptoCred’s Daily Open Trade Strategy walks through one strategy from idea to rules.
Where to go next
The best system in the world fails if you can’t follow it through its worst month. The final Summit guide: Trading psychology at scale: drawdowns, tilt, sizing up.

On the climb since 2017. Trades futures and reads onchain data. Automates the boring parts.
More from VikingXBT →