The short version
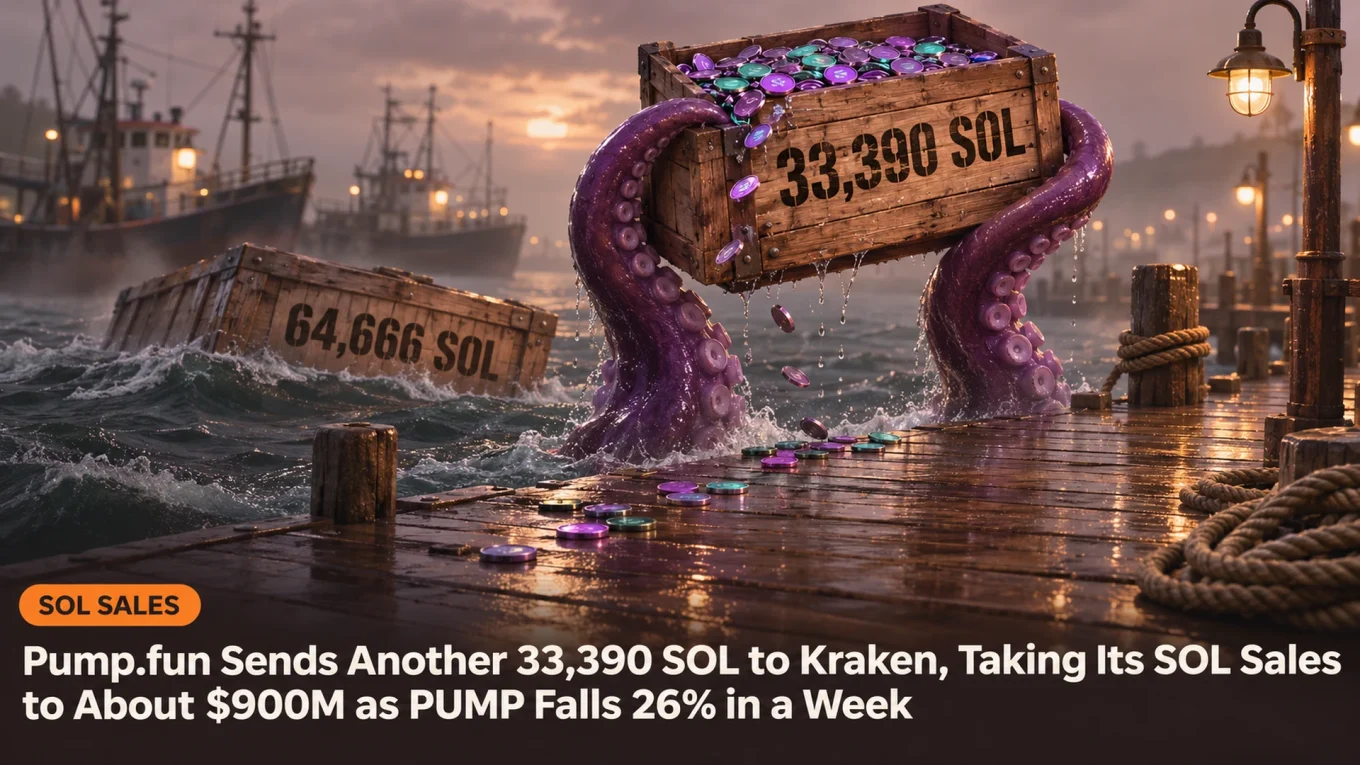
- Pump.fun SOL sales rose to about $900 million since early 2024 after its fee wallet sent 33,390 SOL, about $2.43 million, to Kraken on November 18.
- It was the second transfer in five days after 64,666 SOL on November 13, and the average sale price of about $157 is more than twice today’s $72 SOL.
- PUMP is down 26% in a week to $0.002526 and trades under its 200-day moving average since a 15% drop on November 14.
- Next: whether PUMP holds this week’s $0.00250 low, and whether another transfer follows around November 23.
Five days. That is how long Pump.fun waited this time before shipping another load of SOL to an exchange.
Around 22:30 UTC on Wednesday, November 18, the Pump.fun fee wallet sent 33,390 SOL to Kraken, about $2.43 million at the time. On November 13 the same wallet sent 64,666 SOL, then worth $5.19 million. Together that is 98,056 SOL, roughly $7.6 million, in under a week.
Onchain analyst Ember flagged both transfers. Ember also counts the total Pump.fun SOL sales since early 2024 at about 5.73 million SOL, or roughly $900 million.
The speed is the new part. In Ember’s words, the falling SOL price has Pump.fun selling its fees more often: once every two weeks before, once every five days now.

这 SOL 价格跌的 Pump .fun 都加快了卖手续费的频率😂
之前都是半个月卖一次,现在 5 天就卖一次:
◎5 天前他们才把 64,666 枚 SOL ($519 万) 手续费收入转进 Kraken。
◎今天 2 小时前他们又把 33,390 枚 SOL ($243 万) 手续费收入转进 Kraken。
他们从 2024 年初至今,应该是累计卖出了 572.6
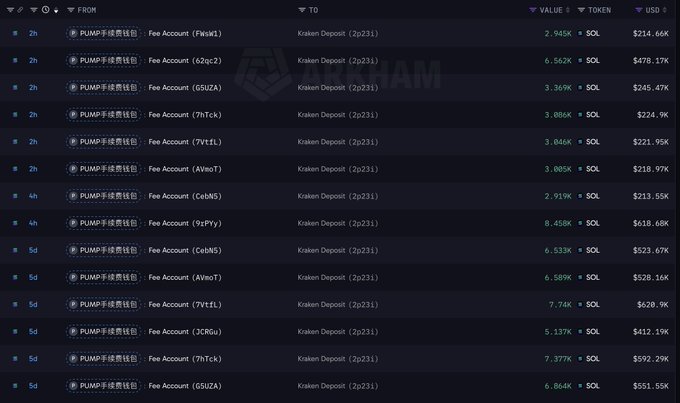
A deposit on an exchange is not a sale on its own. But this wallet collects Pump.fun’s fees in SOL, and onchain trackers have booked its exchange transfers as sales since early 2024.
Where the Pump.fun SOL Sales Stand
Ember’s count after the November 13 transfer was 5.692 million SOL sold for $898 million, an average of about $157.80 per SOL. Add this week’s 33,390 SOL and the tally lands just above 5.72 million SOL and $900 million.
Now look at the price. SOL trades at $72.04 at the time of writing, down 3% over 24 hours and 32% in 30 days. It is 75% below its all-time high of $293.31.
So the average sale sits more than twice above today’s price. Pump.fun sold most of its SOL when it was worth a lot more.
SIDE TRAIL: Pump.fun Revenue Hits Lowest Since September as Rivals Fade Faster
The fees keep coming in, too. tehcscreener.com, which tracks memecoin launchpads, shows a jump in activity over the last two days.
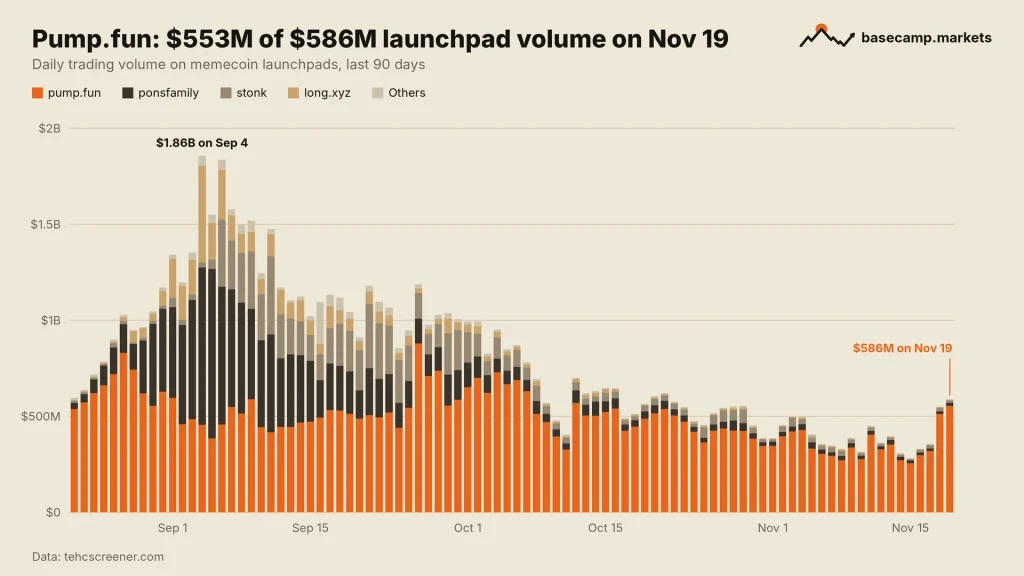
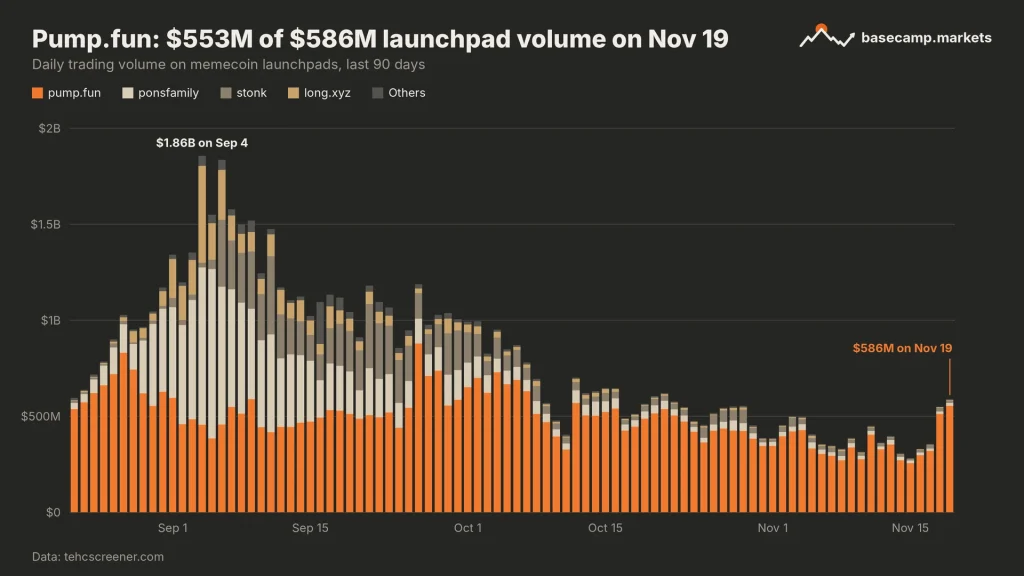
Pump.fun did $553 million of the $586 million traded on memecoin launchpads on November 19. That is 94% of the market, and well above the $350 million or less it did on most days of the past two weeks. More trading means more fees in SOL. And more SOL to sell.
Sponsored · Affiliate link
Save 10% on fees trading on FOMO
Base Camp may earn a commission if you sign up. It never affects what we write.
Why Is PUMP Down 26% in a Week?
The sales are only part of it. The slide started with one bad candle.
The PUMP price is $0.002526 at the time of writing, down 7% over 24 hours and 26% from the November 13 close at $0.003448. It is 71% below its all-time high of $0.008819 from September 2025.
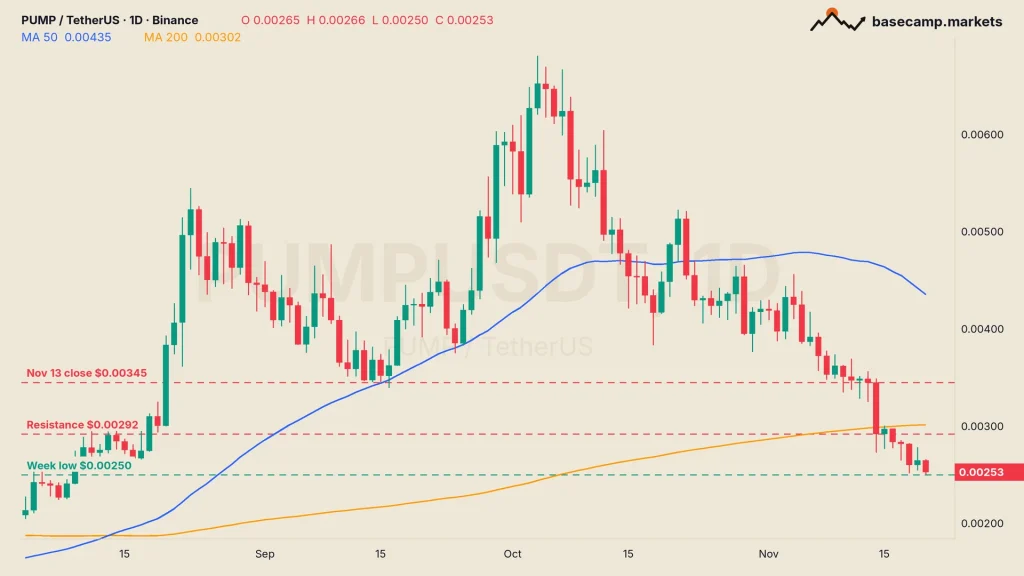
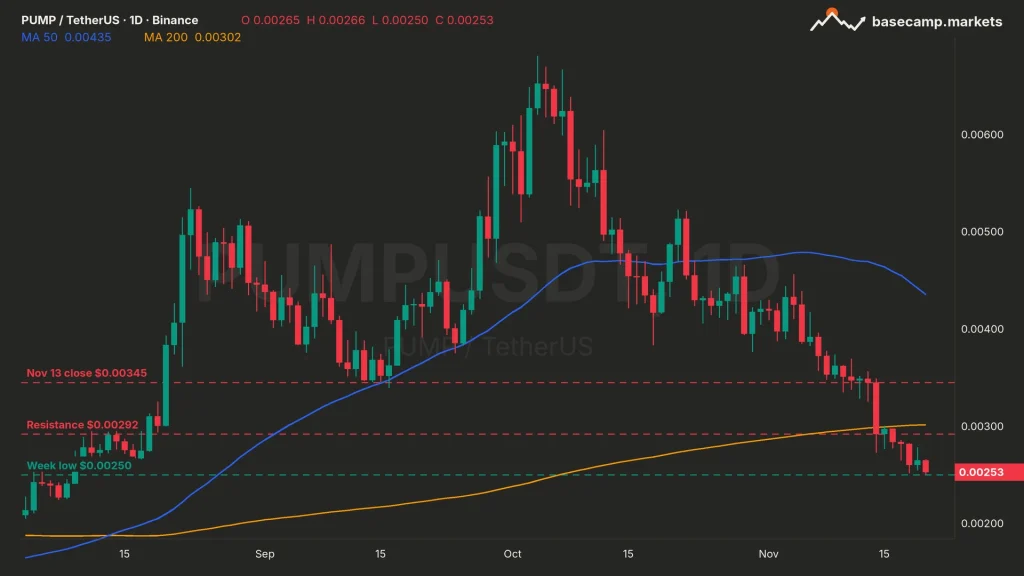
Most of the damage came on November 14. PUMP lost 15% that day and closed at $0.002917, below the 200-day moving average (MA), the average closing price of the last 200 days. It now sits near $0.00302. PUMP hasn’t closed above it since.
That week also carried the monthly 6.875 billion PUMP for the team and early investors, which trackers count in different ways. Our token unlocks roundup has the details.
The levels are simple on the daily chart:
- The ceiling: $0.00292, the November 14 close, with the 200-day MA just above it.
- The floor: $0.00250, this week’s low, tested again today.
Below that, the next swing low on the daily chart is far away, at $0.00176.
Solana isn’t helping either. SOL is down 10% this week and trades under its own 50-day and 200-day MAs.
TRAIL MAP: Solana Price Hits $75, Lowest Since August, as SOL Heads for a Seventh Straight Red Week
What the Kraken Transfers Tell Traders
Not much about Pump.fun’s health. Its launchpad still takes almost all of the volume.
The Pump.fun SOL sales say more about SOL itself. A company that earns in SOL and sells it every five days adds steady supply into a falling market. 98,056 SOL won’t move a $42 billion coin on its own.
But the next transfer will get noticed. If the five-day pattern holds, Ember and the other wallet watchers will be looking at this wallet again around November 23.

TheCryptoMonk has been trading since 2017 and reads the market from the top down. The focus is macro and the high timeframes: where stocks, rates and liquidity are heading, and what the weekly and monthly charts say about Bitcoin. Short-term noise matters less than the bigger trend.
More from TheCryptoMonk