
The short version
- SOL price fell to $74.85 on Binance on Saturday, its lowest since August 17, and trades near $75.80, down 3.9% in 24 hours.
- Six weekly candles in a row have closed red, and this week is down 12.4%: SOL has lost about 38% since late September, against about 23% for Bitcoin.
- Open interest on OKX is falling and funding sits near zero, so longs are leaving without a crowded short side to squeeze.
- Next: the weekly close at 00:00 UTC Monday (7:00 p.m. Sunday in New York); only a close above $86.54 ends the streak, and $70.58 is the floor of the August base.
Open the Solana weekly chart and count the green candles of the last seven weeks. It won’t take long.
There are none. The SOL price trades at $75.80 at the time of writing, down 3.9% over 24 hours, after an early Saturday drop to $74.85 on Binance. That is its lowest price since August 17.
Six weekly candles in a row have closed red. The seventh is down 12.4% with less than two days to go. So where does a slide like this stop?
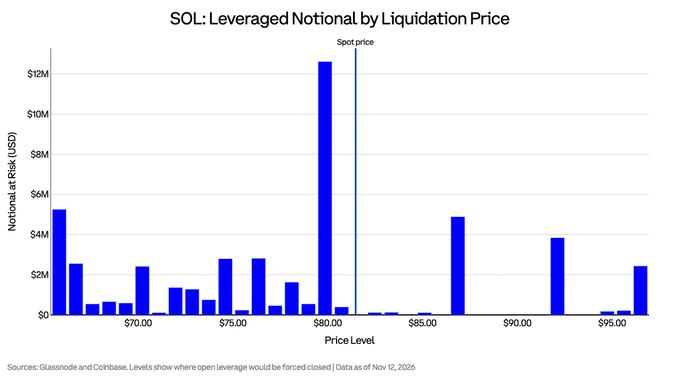
Coinbase’s markets team showed on Thursday night where the leverage sat, with the densest cluster of SOL positions at $79.56 and most of the map below the price. SOL went straight through it on Friday:

$15.6M of leveraged $SOL positions sit within 5% of spot.
Densest cluster: $79.56
Spot: $81.47
54% of the map sits below spot.
Six Red Weeks, and the Seventh Is the Worst
The streak started quietly. The week of September 28 closed just 40 cents under its open. Nobody noticed.
Then the losses got bigger.
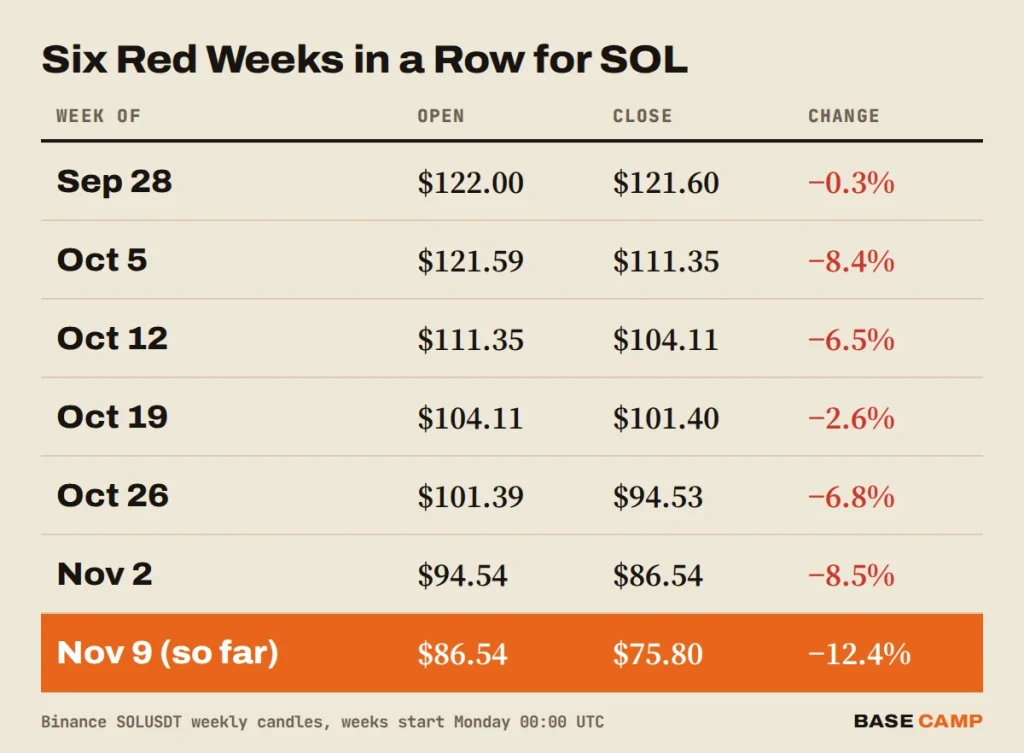
Put together, SOL has lost about 38% since the end of September. No big crash. Just one lower close after another.
This week is the worst of the seven so far. SOL opened Monday at $86.54 and even closed that day a touch higher, at $86.74. Every daily close since has been lower than the one before: $83.35, $83.28, $81.72 and $78.19 on Friday.
The weekly candle closes at 00:00 UTC on Monday, November 16 (7:00 p.m. Sunday in New York). To end the streak, SOL has to close that candle above $86.54.
That is about 14% from here.
Sponsored · Affiliate link
Save 20% on fees trading on WEEX
Base Camp may earn a commission if you sign up. It never affects what we write.
How Rare Is a Seventh Red Week for Solana?
Rare. On Binance’s SOLUSDT chart, which goes back to August 2020, a seventh red week would be Solana’s longest losing streak since the spring of 2022.
Back then, SOL closed ten weeks in a row in the red, from the week of April 4 to the week of June 6, 2022. It went from $136.90 to $30.61, a 78% drop, in the months of the Terra collapse.
The closest thing since came earlier this year. From the week of January 12 to the week of February 16, SOL put in six red weeks and fell from $139.69 to $82.79. The seventh week of that run closed green, at $83.60. This Solana weekly close is on track to go one week further.
Streaks don’t predict anything. They do show how one-sided the selling has been. Six weeks without a single green close means every bounce got sold before Sunday night.
Why Is SOL Falling Faster Than Bitcoin?
Because it is a riskier bet in a market that is selling everything. When Bitcoin drops, traders cut altcoins first and harder.
The numbers show it. This Solana price drop is bigger than Bitcoin’s by a wide margin. Bitcoin is down about 23% since the start of October, from $86,530 to $66,978. SOL is down about 38% over the same stretch.
Against Bitcoin directly, SOL looks just as weak. The SOL/BTC pair closed the week of September 21 at 0.001444 BTC. It sits at 0.001132 now, about 22% lower, and under its own 200-day MA.
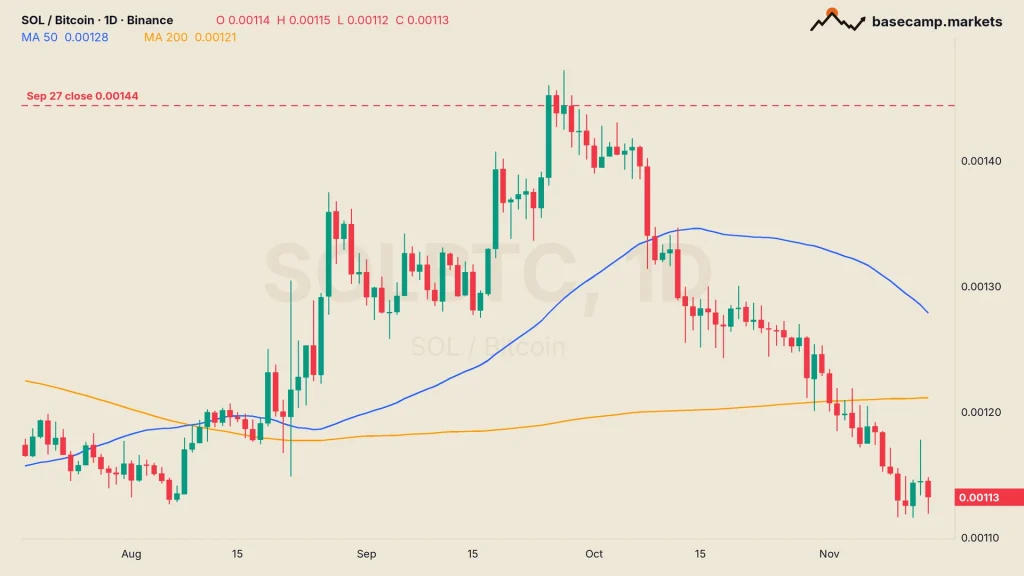
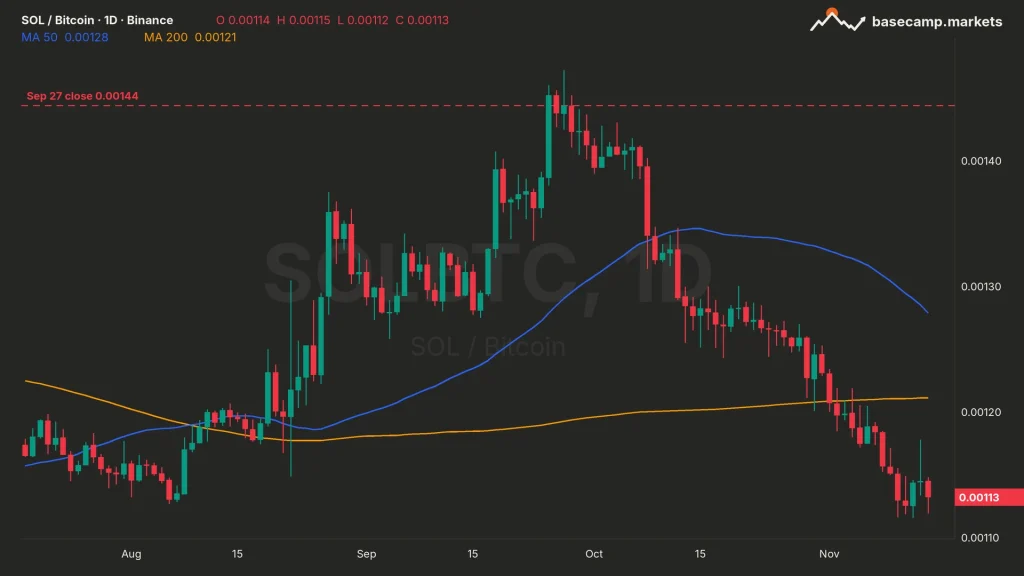
In other words, anyone who held SOL instead of Bitcoin since late September is about 22% worse off.
The backdrop doesn’t help. Bitcoin fell below $70,000 on Friday for the first time since August and trades at $66,978. Ethereum trades near $1,900. The Crypto Fear & Greed Index dropped to 13, extreme fear, from 20 a day earlier.
What about leverage? It is leaving, slowly. Open interest, the value of all open futures bets, in SOL contracts on OKX slipped from about $374 million on November 8 to $342 million on Friday, OKX data shows. The funding rate on its SOL perpetual sits near zero, about 0.001% per eight hours.
That combination matters. Traders are closing longs, but nobody is piling into shorts either. So there is no crowded short side to squeeze, and no forced buying waiting to lift the price.
SIDE TRAIL: Solana Price Slips Below $100 as a Whale Sends $22M of SOL to Exchanges
SOL Price Analysis: Is the August Base the Last Floor?
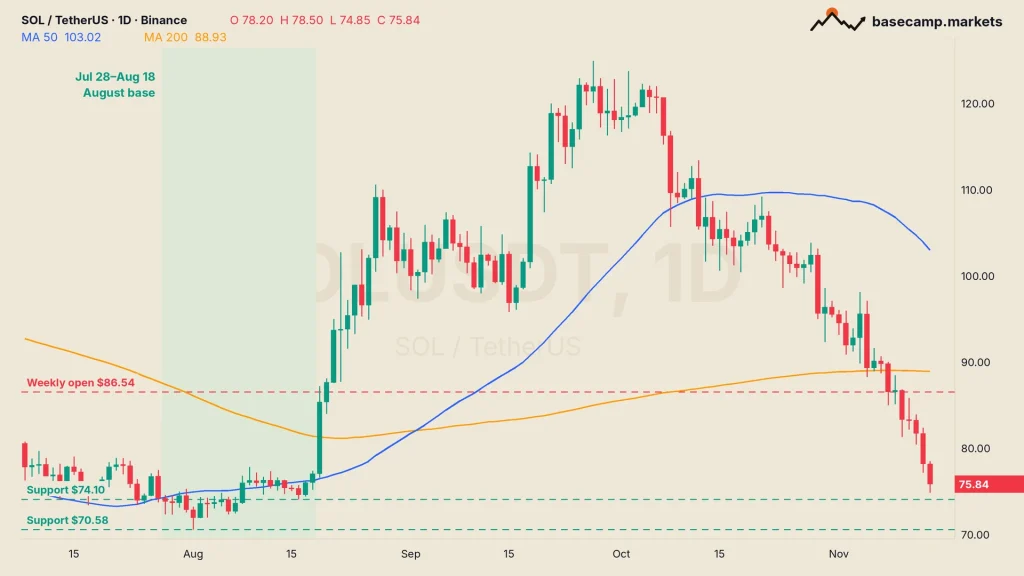
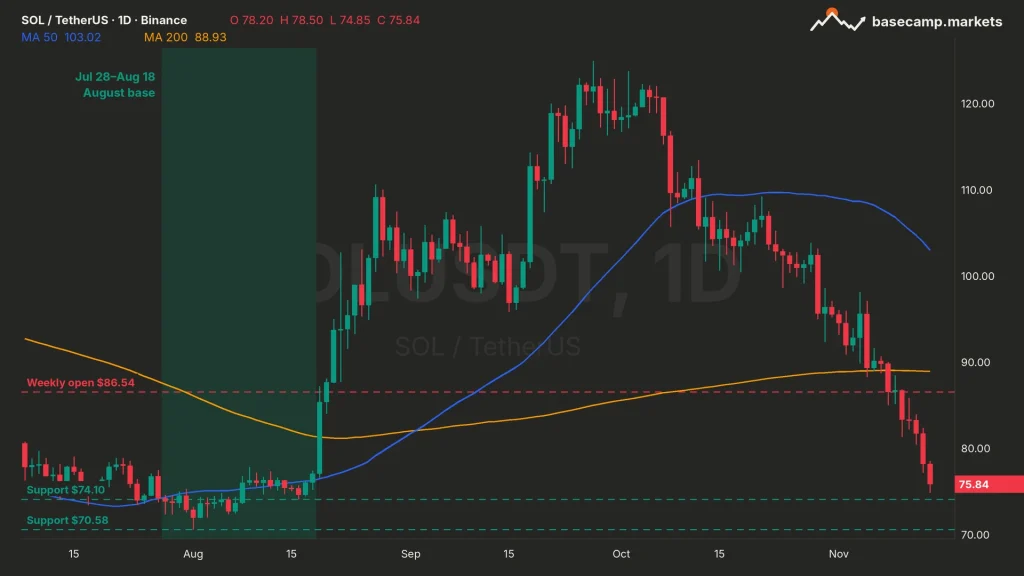
It is the last floor on the chart before a much deeper one. The SOL price is now back inside the range it sat in for three weeks this summer, and that is where this SOL price analysis starts.
From July 28 to August 18, SOL chopped between $70.58 and $77.84. Then it left fast. On August 19 alone it gained about 11%, and by August 27 it had reached $110.60, a run of more than 40% from the August 18 close.
That base is where a lot of buyers got in. Some of them will defend it. Others are just happy to sell at break-even after a round trip.
Trader MarzellCrypto marked the same base on Friday morning, with $77.05 as the line to hold and $70.58 as the target if it broke. It broke a day later:

$SOL BACK WHERE THE AUGUST BREAKOUT STARTED 👀
Ran from $77 to $125 in six weeks, then gave nearly all of it back. Printed $77.92 this morning, now just under $80.
HOLD $77.05 → RECLAIM $85.02 → $88.46 🟢
LOSE $77.05 → $70.58 🔴
Buyers have to show up here.
Not financial
The daily trend is down, and it isn’t close. Both moving averages (MA), the average daily close over the last 50 and 200 days, sit above the price: the 50-day MA at $103.02 and the 200-day MA at $88.93. SOL has closed under the 200-day every day since November 8.
These are the levels that matter on the bigger picture:
- The line to end the streak: $86.54. This week’s open, and the only weekly close that turns this candle green.
- The ceiling above that: $88.93, the 200-day MA. SOL needs a daily close back above it before the trend looks anything but broken.
- The first floor: $74.10, the August 16 low. Saturday’s $74.85 low stopped just above it.
- The base floor: $70.58, the August 1 low and the bottom of the whole summer range.
- Below the base: $60.13, the June 6 low and the lowest price of the past six months, about 21% under the current price.
A weekly close at today’s price would be the lowest since mid-August, when SOL closed the week of August 10 at $74.61. A close under $70.58 would mean the August base has failed.
One bounce does not fix six red weeks. The weekly candle needs a 14% rally in under two days to close green.
TRAIL MAP: Multi-Timeframe Analysis: A Top-Down Routine

TheCryptoMonk has been trading since 2017 and reads the market from the top down. The focus is macro and the high timeframes: where stocks, rates and liquidity are heading, and what the weekly and monthly charts say about Bitcoin. Short-term noise matters less than the bigger trend.
More from TheCryptoMonk