The short version
- Ethereum ETF outflows have passed $1 billion in October, and BlackRock’s ETHA alone lost $157.7 million from Monday to Wednesday.
- US spot Bitcoin ETFs took in $1.07 billion over the same three days, and on Wednesday Fidelity’s FBTC finally joined IBIT.
- The crew is watching ETHA’s daily flow and whether ETH can close back above its 50-day EMA at $2,480.
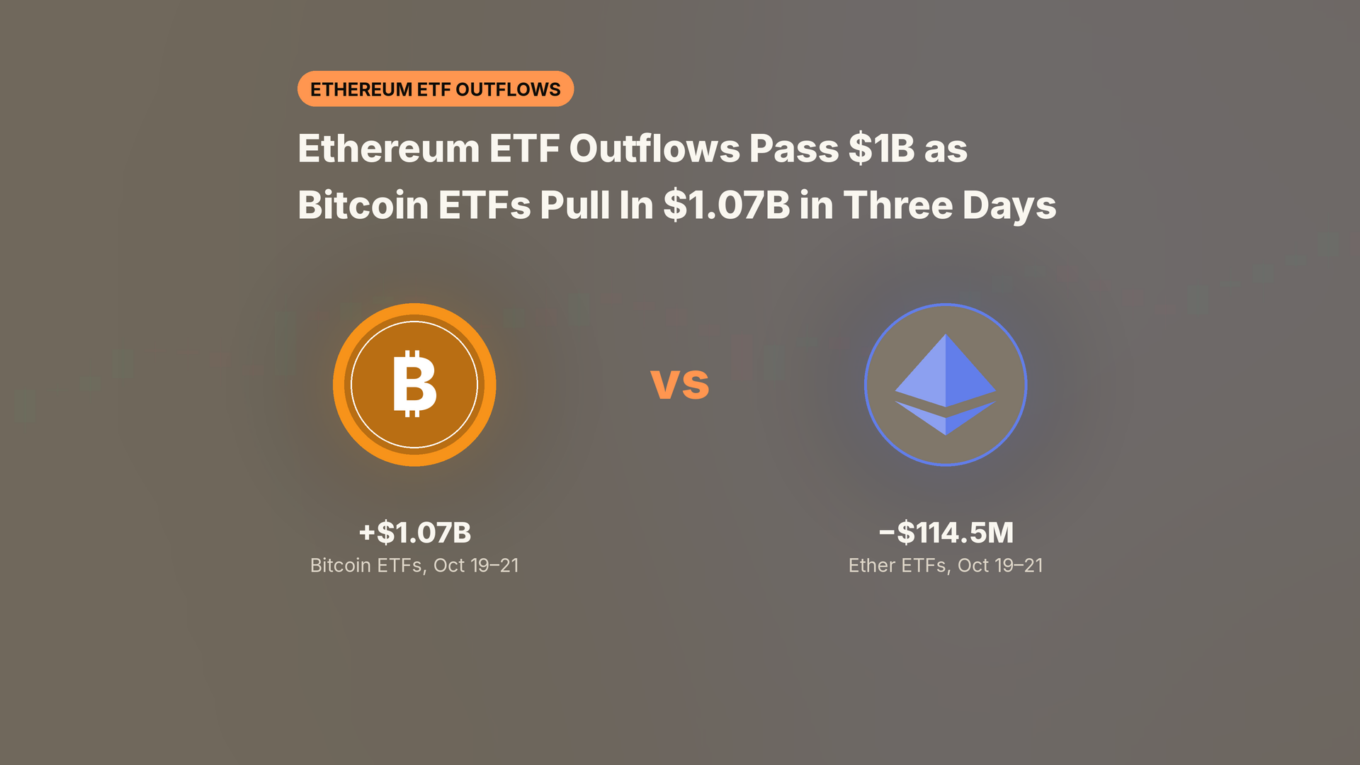
Wall Street is buying one coin and selling the other. Ethereum ETF outflows have passed $1 billion in October, while US spot Bitcoin ETFs took in $1.07 billion in the first three days of this week alone.
Ethereum (ETH USD) trades at $2,441 at the time of writing, up 3.56% on the week but well below the $2,686 it opened the month at. Bitcoin sits at $82,760. Same week, same macro. So why are the two biggest groups of crypto ETFs telling such different stories?
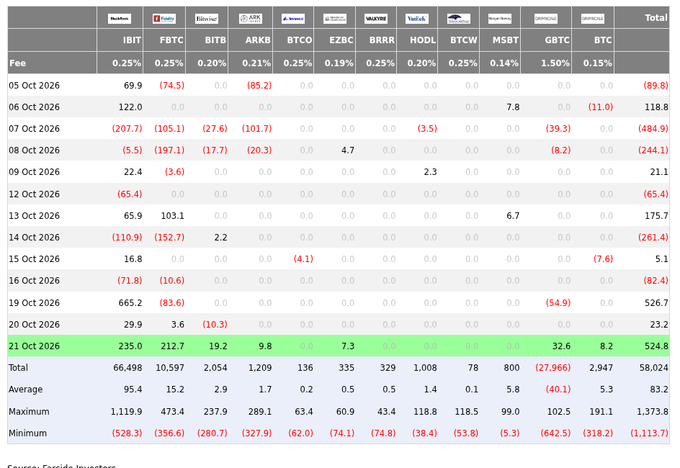
Farside Investors posted Wednesday’s Bitcoin numbers overnight:

𝗕𝗶𝘁𝗰𝗼𝗶𝗻 𝗘𝗧𝗙 𝗙𝗹𝗼𝘄 (𝗨𝗦$ 𝗺𝗶𝗹𝗹𝗶𝗼𝗻) – 2026-10-21
TOTAL NET FLOW: 524.8
IBIT: 235
FBTC: 212.7
BITB: 19.2
ARKB: 9.8
BTCO: 0
EZBC: 7.3
BRRR: 0
HODL: 0
BTCW: 0
MSBT: 0
GBTC: 32.6
BTC: 8.2
How Big Is the Gap Between Bitcoin and Ether ETF Flows?
About $1.19 billion in three days. Bitcoin ETF inflows came to $526.7 million on Monday, $23.2 million on Tuesday and $524.8 million on Wednesday, according to Farside. Ether funds lost $103.3 million and $26.1 million before taking back just $14.9 million on Wednesday. Net: $114.5 million out.
The month looks worse. US spot Ether ETFs had shed $1.08 billion in October through Tuesday, SoSoValue data shows, their biggest monthly outflow of 2026. That wiped out all of September’s $832 million in inflows. Bitcoin funds, meanwhile, have pulled their October back into the green.
Monday was IBIT doing all the work, as we covered in our look at the $665 million day. Wednesday was different. Fidelity’s FBTC added $212.7 million next to IBIT’s $235 million, and seven funds took money in while none lost any. That is the company IBIT was missing.
DISCOVER: Altcoin Season: Rotation, BTC Dominance and Why the Old Playbook Broke
Why Are Ethereum ETF Outflows Growing While Bitcoin ETFs Buy?
Mostly price. Ethereum is down 9.1% since October opened and Bitcoin just 1.0%, and fund money tends to follow whatever is working.
The ETH/BTC ratio shows it best. It measures how much Bitcoin one ETH buys, and it slid from 0.0321 at the end of September to 0.0295 now. That is an 8.2% drop in three weeks, and an ETF buyer choosing between the two sees it every morning.
The selling also comes from one place. BlackRock’s ETHA lost $95.4 million on Monday, $33 million on Tuesday and $29.3 million on Wednesday: $157.7 million in three days. Wednesday’s small inflow, which ended a five-day losing streak, came from Grayscale’s Ethereum Mini Trust and Fidelity’s FETH while ETHA kept selling.
In other words, the biggest Ether fund is still heading for the exit while the smaller ones nibble. Flows show where new money goes, not where price goes next, but Ethereum ETF outflows this steady rarely sit well with a rally.
Ethereum Price Analysis: Can ETH Get Back Above $2,500?
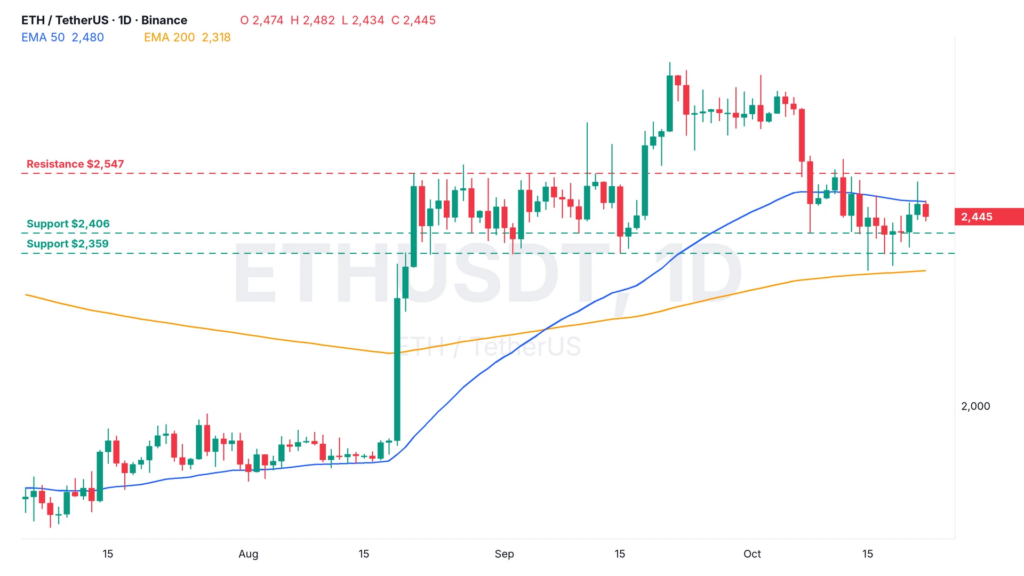
Not yet. ETH trades just under its 50-day exponential moving average (EMA), a trend line that weights recent prices more, at $2,480, and above the 200-day EMA at $2,318. It is stuck between the two.
Wednesday’s push to $2,526 was sold. The first ceiling above is $2,546, then the October 12 high at $2,579. Below, the floors are the October 8 low and the mid-October lows sitting just above the 200-day EMA.
- In the bull case, a daily close back above the 50-day EMA, with ETHA buying again, would put October’s opening price back in view.
- In the base case, Ether chops between $2,406 and the October 12 high while the funds stay mixed.
- In the bear case, a daily close below $2,358 would put the 200-day EMA back on the table.
Sponsored · Affiliate link
Save 20% on fees trading on WEEX.
Base Camp may earn a commission if you sign up. It never affects what we write.
EXPLORE: Indicators Worth Knowing: Moving Averages, RSI and Volume
Watch the ETHA line in the Farside table more than the total. The day BlackRock’s Ether fund buys alongside IBIT is the day this split starts to close. Until then, the big money is picking Bitcoin.

On the climb since 2017. Trades futures and reads onchain data. Automates the boring parts.
More from VikingXBT →