The short version
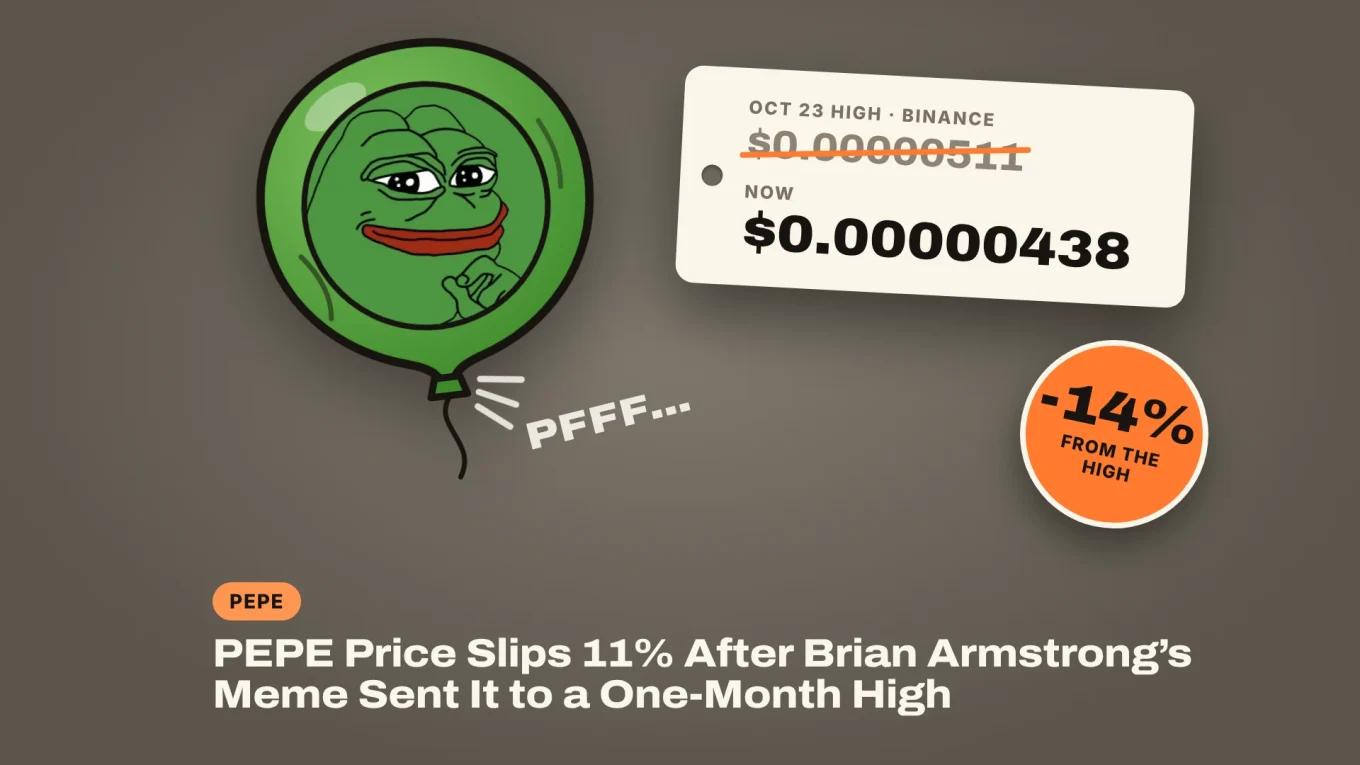
- PEPE price hit $0.00000511 on Binance on October 23, a one-month high, after Brian Armstrong posted a frog meme, and now trades 14% lower at $0.00000438.
- The PEPE rally was a solo move fed by futures: PEPE gained 13.4% in a week while DOGE and SHIB fell, OKX open interest rose 39% and Upbit showed no kimchi premium.
- The crew is watching for a weekly close above $0.00000445, the neckline of an inverse head and shoulders on the weekly chart, with $0.00000406 as the support below.
The PEPE price did what memecoins do best this week: it ran hard, made a lot of noise and then gave half of it back. PEPE touched $0.00000511 on Binance on October 23, its highest level in a month, on $112 million of spot volume. At the time of writing it trades at $0.00000438, down 11% in 24 hours.
The spark was a frog. Coinbase CEO Brian Armstrong posted a Pepe-style warrior meme on X on October 22, and the next day PEPE had its busiest trading day since September. So is this the start of a bigger memecoin move, or the same spike-and-fade PEPE traders saw a month ago?
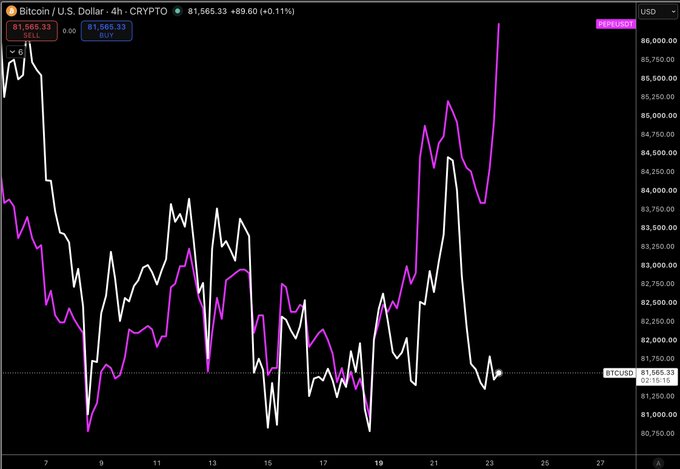
Traders noticed the strength while the rest of the market wobbled:

Why Did PEPE Rally This Week?
Because of attention, not news. Armstrong’s post showed a frog warrior with a sword and a list of life rules, and it didn’t mention PEPE or any token. It didn’t have to. In crypto, the CEO of the biggest US exchange posting a frog is enough to send traders looking for the ticker.
What stands out is how alone the PEPE rally was. From the October 16 close to the October 23 close, PEPE gained 13.4% on Binance. Dogecoin lost 2.9% over the same days, Shiba Inu 2.4% and Floki 1.8%, while Bitcoin slipped 0.5%. This wasn’t a memecoin season. It was one frog.
The move started before the meme, too. On October 20 PEPE jumped 9.6% on $62 million of volume, its biggest day in almost four weeks. Armstrong’s post then poured fuel on a rally that was already looking for a reason.
There is a slower story in the background. Canary Capital filed an amended S-1 for a spot PEPE ETF with the SEC on October 2. Nothing is approved and no listing date exists, but it keeps PEPE on the radar of traders who bet on the next ETF headline.
DISCOVER: Bitcoin vs Altcoins vs Stablecoins vs Memecoins: What You’re Actually Buying
Who Was Buying PEPE: Korea or Leverage?
Mostly leverage. Korean traders did show up: PEPE volume on Upbit hit about $12.4 million on October 23, more than seven times the day before. But the kimchi premium, the gap between Korean and global prices, stayed near zero. PEPE traded at about $0.00000439 on Upbit at the time of writing, level with Binance. When Korea leads a pump, that gap usually blows out.
Futures tell a louder story. Open interest, the value of all open futures positions, rose from about $28 million on October 18 to $39 million today on OKX, a 39% jump in less than a week. A short squeeze, traders who bet on a drop being forced to buy back, helped push the price above $0.000005.
In other words, a good part of this rally was traders betting on the move with borrowed money and shorts getting squeezed out. That kind of buying leaves fast.
Is the PEPE Rally Already Fading?
It looks like it. PEPE closed October 23 at $0.00000457, about 11% below the day’s high, and today it sits under that close again. Spot volume on Binance has dropped back to about $16 million so far today.
PEPE traders have seen this film. On September 22 PEPE spiked to $0.00000536 on $124 million of volume, closed well off the high, then slid 29% from that peak to $0.00000383 by October 8. This week’s high stopped short of that September top, which makes it a lower high.
The bigger picture hasn’t changed either. PEPE is still 84% below its $0.00002803 all-time high from December 2024 and 39% lower than a year ago. It has doubled from the July 1 low at $0.00000223, though, so the bounce off the bottom is real.
EXPLORE: Funding Rates and Open Interest: Reading the Leverage in the Market
Sponsored · Affiliate link
Save 5% when buying Breakout Prop evaluations
Base Camp may earn a commission if you sign up. It never affects what we write.
PEPE Price Analysis: Can PEPE Hold Above Its 50-Day EMA?
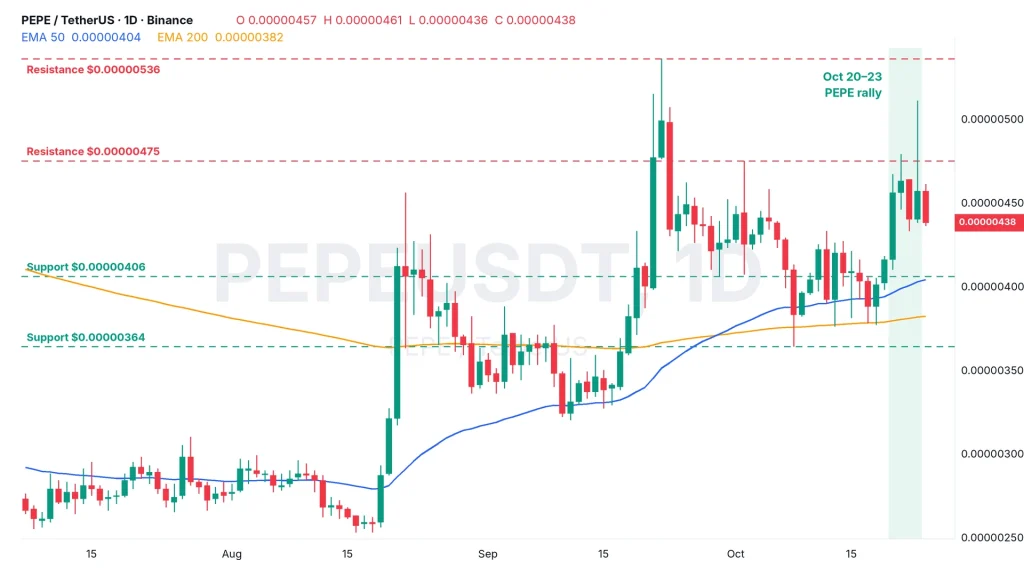
For now, yes, but it has little room left. The PEPE price sits at $0.00000438, about 8% above the 50-day exponential moving average (EMA), a moving average that weights recent prices more heavily, at $0.00000404. The 200-day EMA is lower at $0.00000382. The Fear & Greed Index reads 51, neutral.
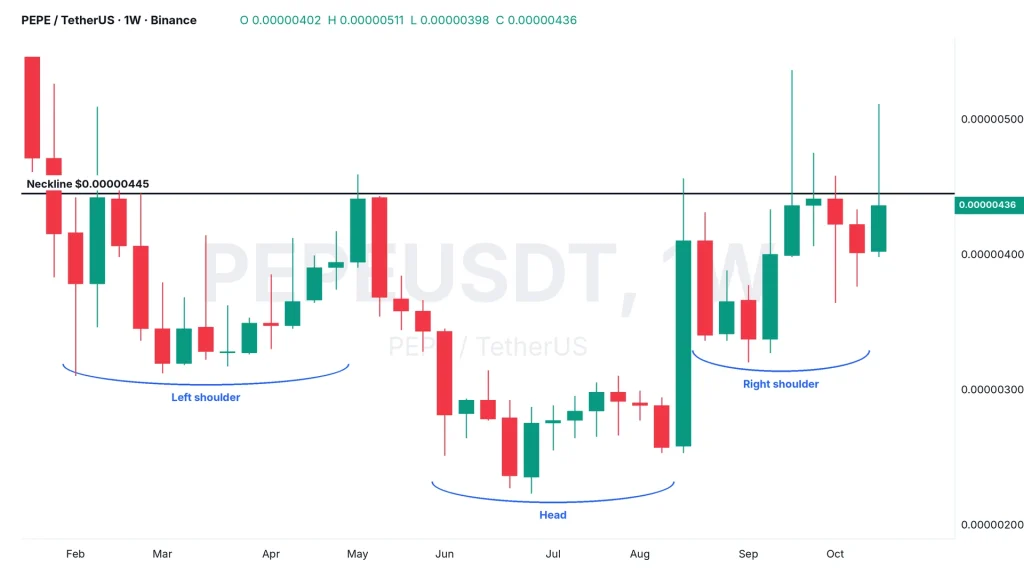
Zoom out to the weekly chart and a bigger setup shows. Since February PEPE has drawn an inverse head and shoulders, a bottoming pattern traders read as bullish: a low near $0.00000310 in February and March, a deeper one at $0.00000223 in July, and a higher low in September. The neckline sits at about $0.00000445, and PEPE hasn’t closed a week above it since January. This week’s spike to $0.00000511 is the seventh wick through it since February.
A weekly close above the neckline would confirm the pattern. The textbook target adds the head’s depth to the neckline, which points to about $0.00000667, roughly 52% above the current price.
- Bull case: a weekly close above $0.00000445 completes the inverse head and shoulders and opens $0.00000511, then the September top at $0.00000536.
- Base case: chop between $0.00000406 and $0.00000475 while the leverage clears out.
- Bear case: a close below $0.00000406 and the 50-day EMA puts the 200-day EMA at $0.00000382 and the October 8 low at $0.00000364 in play.
A meme can start a rally, but it can’t hold one up. If open interest keeps climbing while the price drifts lower, the next leg is more likely to be a flush than a breakout.

On the climb since 2017. Trades futures and reads onchain data. Automates the boring parts.
More from VikingXBT →