
The short version
- Funding is a regular payment between longs and shorts that keeps a perp’s price close to spot. Positive: longs pay shorts. Negative: shorts pay longs.
- The usual baseline is 0.01% every 8 hours, about 11% a year. Much higher means longs are crowded and paying up.
- Open interest (OI) is the total value of open futures positions: a measure of how much leverage is in the market.
- Rising OI with extreme funding is fuel for a squeeze. When it unwinds, price moves fast.
Price shows you what the market did. Funding rates and open interest show you how it’s positioned: who’s leveraged, which way, and how much. That matters, because in crypto the biggest moves often come from leveraged traders being forced out, not from news.
These two numbers are free on sites like CoinGlass and on most exchanges. This guide explains what they measure and how to read them together.
What funding is
A perpetual future never expires, so nothing forces its price to meet the spot price at a set date. Funding does that job instead.
The funding rate is a small payment exchanged between traders, typically every 8 hours (some exchanges, like Hyperliquid, settle hourly):
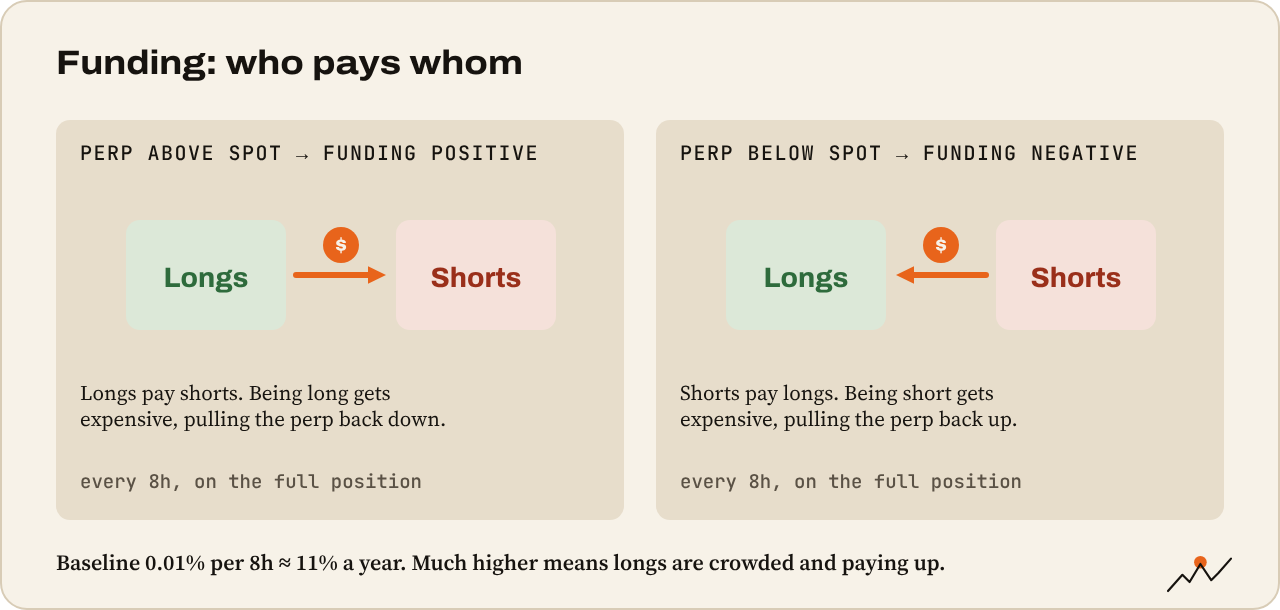
- Positive funding: the perp trades above spot. Longs pay shorts. That makes being long more expensive and pulls the perp price back down.
- Negative funding: the perp trades below spot. Shorts pay longs.
The exchange doesn’t keep it; traders pay each other. You pay or receive funding only if you hold a position at the funding time.
How much funding costs
Funding is charged on your whole position size, not your margin. That’s what makes it sneaky at high leverage.
On most big exchanges, the neutral rate is 0.01% every 8 hours. Three payments a day for a year is about 11%. In a hot market it can run at 0.05% to 0.1% per 8 hours or more, which annualizes to 55% to 110%.
Example: a $20,000 long held for 30 days at 0.03% per 8 hours. $20,000 × 0.03% × 3 × 30 = $540. If you posted $2,000 of margin at 10x, funding alone ate 27% of it.
Our funding calculator works out the cost for any size and period:
Base Camp tool
Funding rate cost
What holding a perpetual futures position costs (or pays you) over time.
For learning only, not financial advice.
Reading funding as a signal
Because funding shows which side is paying to stay in, it’s a decent gauge of crowding:
- Around the baseline (0.01% per 8h): balanced. Nothing special.
- Very positive: longs are eager and leveraged. Rallies can keep going for a while, but the market is fragile. A drop can trigger a long squeeze, longs being liquidated one after another.
- Negative, especially while price rises: shorts are piling in against the move. That’s fuel for a short squeeze.
- Deeply negative after a crash: fear and shorts everywhere. Often near local bottoms, though not always.
Funding is a mood, not a timing tool. Markets can stay over-heated for weeks. Use it to judge risk, not to call the top.
What open interest is
Open interest (OI) is the total value of all futures positions currently open. Every long has a matching short, so OI counts one side. If 1,000 traders are long $10 million in total and the other side is short $10 million, OI is $10 million.
- OI rising: new positions are opening. More leverage is entering.
- OI falling: positions are closing, by choice or by liquidation.
OI doesn’t tell you direction on its own. It tells you how much leverage is in play, which is how much fuel there is for a forced move.
OI and price together
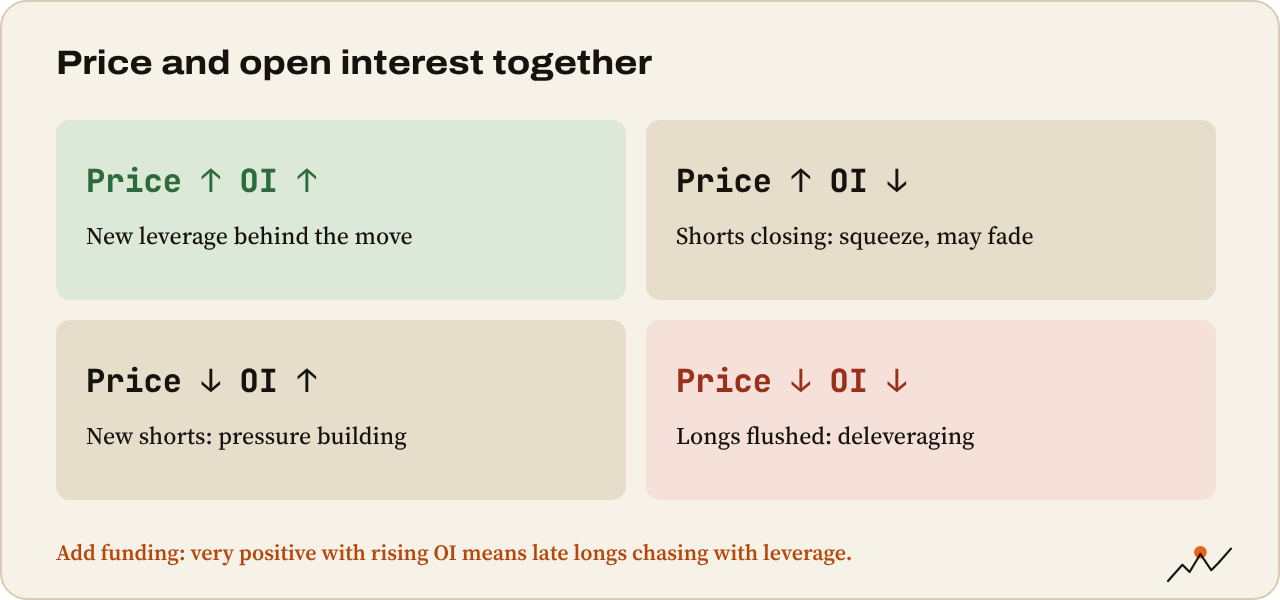
| Price | OI | What it often means |
|---|---|---|
| Up | Up | New longs (or shorts fighting the move) opening. Trend has fresh leverage behind it |
| Up | Down | Shorts closing or being squeezed. Rally driven by short covering, may fade |
| Down | Up | New shorts opening, or longs adding. Pressure building |
| Down | Down | Longs closing or liquidated. Deleveraging; often the flush before a bottom |
Add funding and the picture gets sharper. Price up, OI up and funding very positive: late longs are chasing with leverage. Price flat, OI climbing to records and funding negative: a lot of shorts in a market that isn’t falling, which is how squeezes start.
Liquidations and cascades
When price moves sharply, leveraged positions hit their liquidation prices. Each liquidation is a forced market order: liquidated longs sell, liquidated shorts buy. That pushes price further, hitting the next group. That chain is a liquidation cascade.
You’ll see it on the chart as a long wick and on data sites as a spike in liquidations with a sharp drop in OI. The October 10, 2025 crash, with more than $19 billion liquidated, was the biggest example yet. Afterwards, with much of the leverage gone, markets often calm down.
A liquidation heatmap estimates where clusters of liquidation prices sit. Price is often drawn toward big clusters, because that’s where forced orders wait. We go deeper in the Summit guide on order books, funding and open interest together.
Where to find the data
- CoinGlass: funding across exchanges, OI, liquidations, heatmaps, long/short ratios.
- Your exchange: funding rate and countdown on every perp page.
- TradingView: some exchanges publish OI and funding as chart data.
Look at aggregated numbers across exchanges where you can. One exchange’s funding can be skewed by its own users.
How to use this in practice
- Holding a leveraged position for days? Check the funding cost before entering. A good trade can turn mediocre after a week of paying 0.05%.
- Chasing a breakout? If funding just spiked and OI jumped, you’re joining a crowd. Smaller size, or wait for the flush.
- Price grinding up on negative funding and rising OI? Shorts are fighting the trend. That’s fuel.
- After a big liquidation flush? OI reset and funding back to neutral can mean the leverage has been cleaned out.
Watch out. Funding and OI describe positioning. They don’t predict direction, and the crowd is sometimes right for a long time. Never take a trade on funding alone; combine it with structure and levels, and keep your stop.
Quick check before a leveraged trade
- What’s the funding rate, and what does holding cost per day?
- Is funding near the baseline or at an extreme?
- Is OI rising or falling with price?
- Are big liquidation clusters sitting near my stop?
Where to go next
That’s derivatives. The last Ridge guide takes you onchain, to the apps that work without an exchange: DeFi basics: swaps, liquidity pools, impermanent loss.

On the climb since 2017. Trades futures and reads onchain data. Automates the boring parts.
More from VikingXBT →