The short version
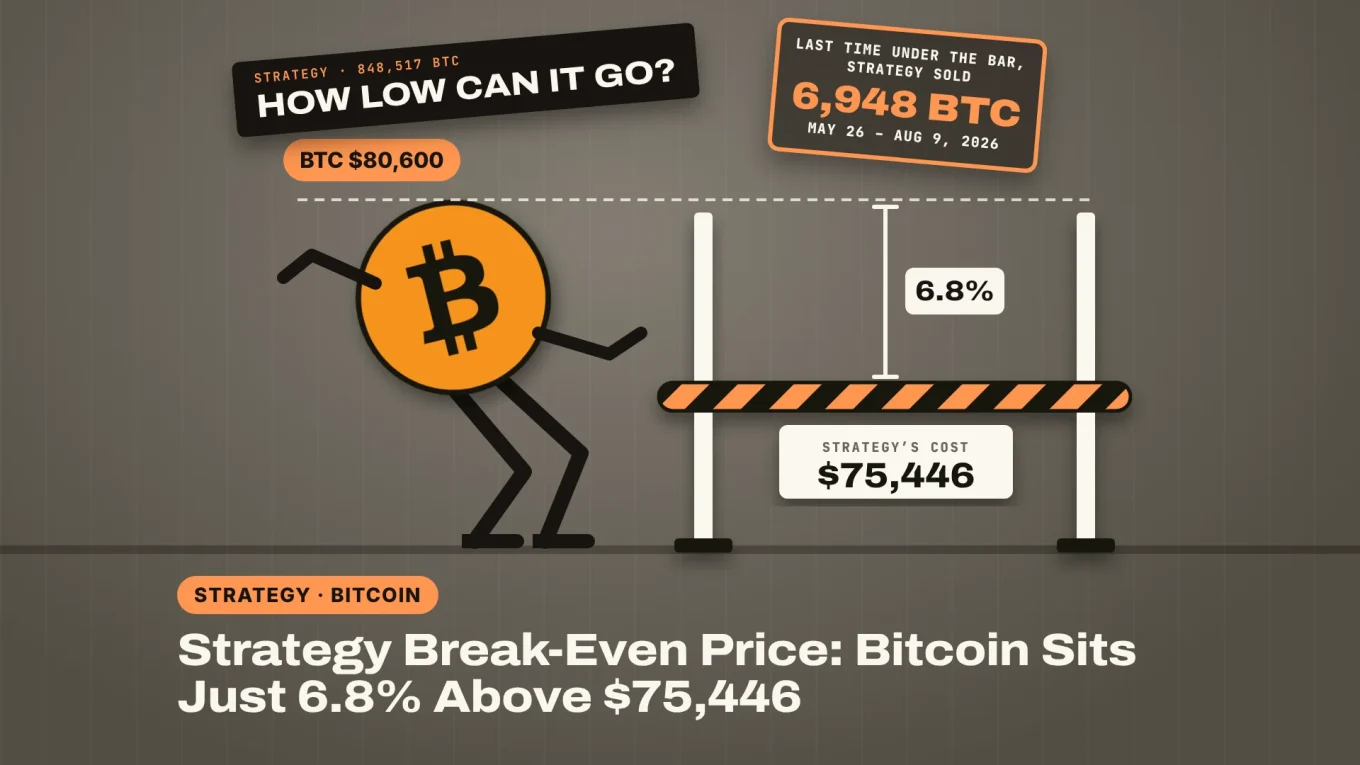
- Strategy break-even price: the company paid an average $75,446 for its 848,517 BTC, and Bitcoin at $80,600 is only 6.8% above it, a paper gain of $4.37 billion.
- The last time BTC fell below that line, Strategy sold 6,948 BTC between May 26 and August 9 to fund preferred dividends and buybacks; its dollar reserve is now $4.83 billion, up from $900 million in May.
- The crew is watching the $79,221 October low, the 200-day EMA at $76,313 and Strategy’s Q3 results on Thursday, October 29, after the US close.
The Strategy break-even price is $75,446 a coin, and Bitcoin is only about $5,150 above it. The company holds 848,517 BTC bought for $64.02 billion, according to its October 19 filing. At $80,600 at the time of writing, that stack is worth about $68.39 billion, a paper gain of $4.37 billion.
That cushion is thin. A 6.4% drop would wipe it out, and Bitcoin already did far worse than that this year. Strategy reports its third-quarter results on Thursday after the close, so what happens to the books if BTC slips under the line again?
Michael Saylor posted the latest count on Monday:

Strategy has repurchased $193M of $STRC and acquired 267 $BTC. As of 10/18/26, we hold 848,517 BTC and $5.3B of USD Assets. We have also increased the size of our Digital Credit Securities Repurchase Program from $2.0B to $3.0B. $MSTR strategy.com/press/strategy…
How Far Is Bitcoin From the Strategy Break-Even Price?
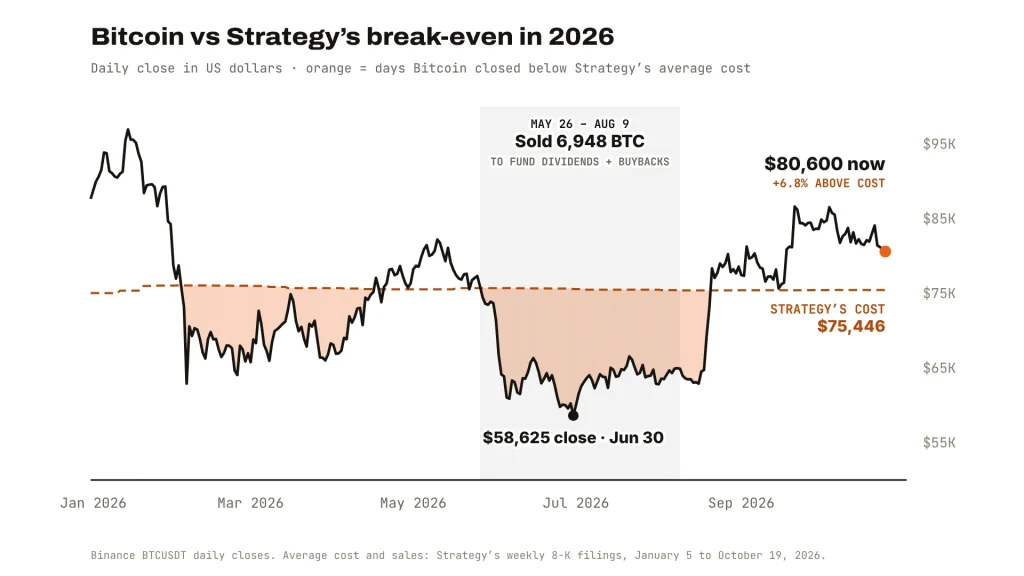
About 6.8% above it, or $5,154 a coin. The Strategy break-even price has barely moved all year: it stayed between $75,026 and $76,056 in every weekly filing since January, because the company buys a few hundred coins a week at most now. Last week it added 267 BTC at $82,900, which nudged the average up by $2.
The real gap is in what Bitcoin has done around that line. BTC closed below Strategy’s cost from early February to mid-April, and again from late May to August 20. The low was a $58,625 close on June 30, about 22% under the company’s average. Since August 21, Bitcoin has closed above the line every day; the closest call was $75,644 on September 15, about $200 over it.
Sponsored · Affiliate link
Save 20% on fees trading on WEEX
Base Camp may earn a commission if you sign up. It never affects what we write.
What Happened the Last Time Bitcoin Fell Below Strategy’s Cost?
Strategy sold Bitcoin. Between May 26 and August 9 it sold 6,948 BTC for about $432 million. Apart from 32 coins in late May, they went at $59,000 to $64,000, well under the $75,500 they had cost.
The July 6 filing spells out why. The money paid dividends on Strategy’s preferred stock and refilled the dollar reserve set aside for those payments, which had shrunk to $900 million by the end of May. On June 29 the company announced a “BTC Monetization Program” to raise up to $1.25 billion more by selling coins. In August, part of the money also went to buying back STRC, its Stretch preferred stock.
The second quarter showed the damage. Strategy booked an $8.32 billion loss on its bitcoin, and the stack was carried at $49.67 billion on June 30, below what it had paid. Then the market turned. Bitcoin jumped from $63,000 to $78,000 in a week in late August, Strategy bought 4,603 BTC at $80,318 that week, and it hasn’t sold a coin since.
DISCOVER: Bitcoin Below $80K: How the Drop Swept the Stops and $402M in Longs
What Changes on the Books if BTC Drops Under $75,446?
Less than the headlines suggest. Strategy marks its coins at the market price every quarter, so a fall hits earnings whether Bitcoin is above or below the cost line. The quarter-end price is what counts: the third quarter closed with Bitcoin near $83,500, and the company has already said it will report a $20.91 billion gain on its bitcoin and a $70.82 billion carrying value for September 30.
The fourth quarter is already in the red. At $80,600, the coins are worth about $2.5 billion less than that September 30 value, counting the 851 BTC bought since.
Three things do change below $75,446:
- Taxes: Above cost, Strategy books a deferred tax bill on its gains ($1.88 billion at September 30). Below cost, it has a tax asset instead and cancels it out on the books, as it did in June.
- The story: “Strategy’s bitcoin is underwater” is a headline that sells, and it weighs on MSTR. The stock closed at $146.01 on Friday, down 48.8% in a year.
- The premium: Strategy’s dashboard puts its mNAV at 1.16, meaning the company is valued at 16% more than its bitcoin. Selling new MSTR shares to buy coins only adds Bitcoin per share while that number stays above 1.
The difference from June is the cash pile. Strategy now holds $4.83 billion in its dollar reserve plus $447 million of spare cash, about 41 months of preferred dividends by its own count. In May, the reserve was $900 million. A dip below cost this winter wouldn’t force a sale the way it did in the summer.
What to Watch When Strategy Reports on Thursday
Strategy reports its third-quarter results after the US close on Thursday, October 29, with a live webinar at 5:00 p.m. Eastern. The big Q3 numbers are already out, so these MSTR earnings are about what comes next.
- The vote on Wednesday: A special meeting on October 28 decides whether STRC moves to daily dividends. If it passes, November’s payout is set at 12% a year.
- Buybacks versus Bitcoin: Last week Strategy spent $193 million buying back STRC and $22 million on Bitcoin. The board also raised the preferred buyback program from $2 billion to $3 billion.
- The sales question: Whether the company will sell coins again if Bitcoin trades below cost, now that the dollar reserve covers more than three years of dividends.
Bitcoin Price Analysis: Can BTC Stay Above Strategy’s Cost?
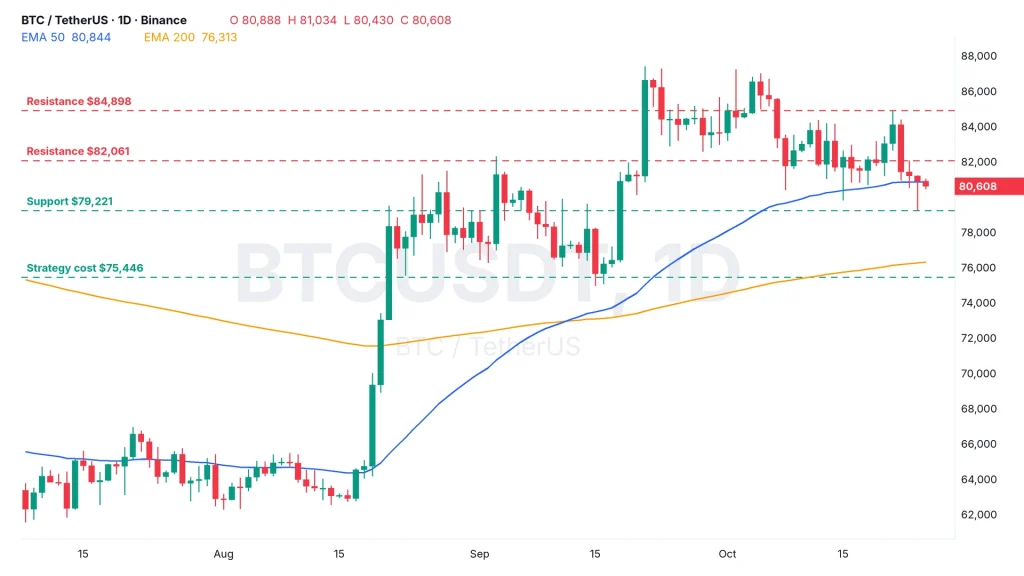
For now, yes, with two floors in between. Bitcoin trades at $80,600, right on its 50-day EMA at $80,844. The 200-day EMA sits at $76,313, less than $900 above Strategy’s cost.
- The first ceiling: $82,061. Friday’s high, where the last bounce stalled.
- The bigger ceiling: $84,898. Wednesday’s high, the top of this month’s range.
- The floor to defend: $79,221. Saturday’s low, the lowest price in October.
In the bull case, BTC closes above $82,061 and runs at $84,898, taking Strategy’s cushion back above 12%. In the base case, it chops between $79,221 and $82,061 into the Fed meeting on October 28 and the results the day after. In the bear case, a daily close under $79,221 opens the way to the 200-day EMA near $76,300, and below that, Strategy’s $75,446 line.
EXPLORE: Fed Meeting Next Week: Traders Bet on a Hold. What It Means for Bitcoin
Strategy can live with Bitcoin under its cost; it did for most of the summer. What changed is how it would pay its bills if it happened again, and Thursday’s call is the first chance to hear whether selling coins is still on the table.