The short version
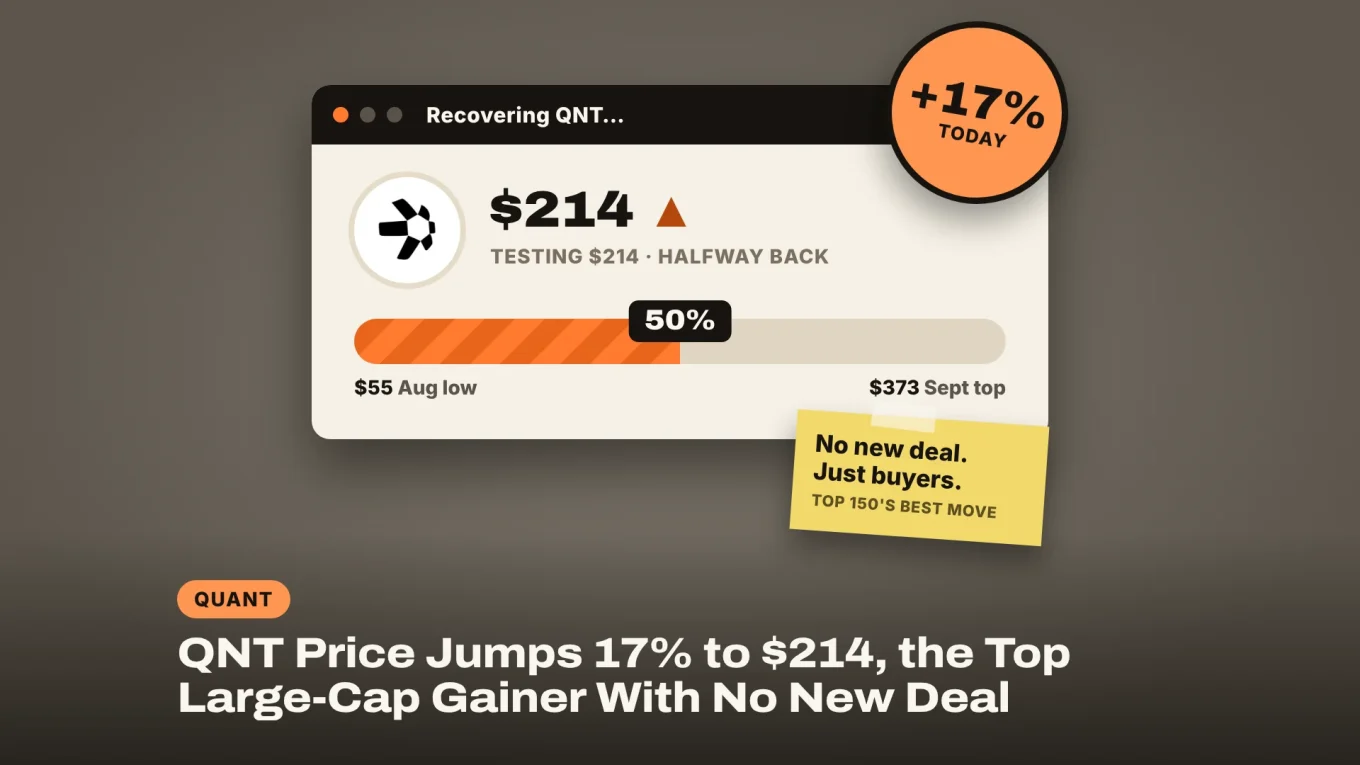
- QNT price jumped 17% to $214 in 24 hours, the best move in the top 150 coins, while Bitcoin and Ethereum stayed flat.
- No new Quant deal or filing is behind it: it’s a thin-volume bounce from Saturday’s $173.56 low, still 43% below the $373 September top set after The Clearing House picked Quant.
- The crew is watching for a daily close above $214, the halfway mark of the summer rally, with $173 to $177 as the floor below.
The QNT price did something nothing else in the top 150 managed on Monday: it ran. Quant’s token trades at $214 at the time of writing (11:20 UTC), up 17% in 24 hours, while Bitcoin and Ethereum barely moved.
The next best large cap, AKE, gained 9%. So what changed for Quant? On the news side, nothing we could find. No new bank, no new filing, no listing. The move is a rebound inside a story the market already knows, and it has run straight into a very specific level.
Why Is the QNT Price Up Today?
Because buyers came back to a coin that had been sliding for a month, not because of a fresh announcement. Quant’s last big news was on September 24, when The Clearing House, the bank-owned group behind the US CHIPS and RTP payment networks, picked Quant to run the interoperability layer of its tokenized-deposit network.
Quant announced the deal on its own account that day:

Big news: Quant is partnering with @TCHtweets to bring on-chain, #programmablemoney to the US.
We will provide the interoperability layer that lets #tokeniseddeposits move freely within the regulated banking system.
This builds on our work in the UK, Europe and beyond.
Read
That deal lit the fuse. QNT went from $66.87 on September 21 to a $373 wick on September 27 on Binance, up 458% in six days. It closed that day at $286 and has been leaking lower ever since, down to $173.56 on Saturday.
The bounce came in two pushes. QNT jumped 5% in one hour on Sunday evening (17:00 UTC), then climbed from $195 to above $208 in the two hours after 08:00 UTC on Monday and kept grinding higher. Neither hour lines up with a Quant post, a Clearing House update or an exchange notice.
It isn’t a sector trade either. Other coins sold on the “banks on blockchain” theme stayed flat: Stellar’s XLM is down 0.2%, Chainlink’s LINK is up 0.4% and Hedera’s HBAR 0.8% (CoinGecko).
Sponsored · Affiliate link
Save 20% on fees trading on WEEX
Base Camp may earn a commission if you sign up. It never affects what we write.
How Big Is This Rally Compared With September?
Small. QNT traded about $124 million across all exchanges in the past 24 hours, and Binance’s QNT/USDT pair did $12.2 million on Monday up to 11:20 UTC. On September 27, that one pair traded $211 million.
So this is a thin-volume bounce, a fraction of September’s money. That cuts both ways. It doesn’t take much buying to push QNT up, and it doesn’t take much selling to push it back.
Two things work in Quant’s favor. There is almost no supply overhang: 14.56 million QNT circulate out of a 14.61 million maximum, so no token unlock is waiting to hit the market. And the tokenized deposits network has a date on it. The Clearing House says participating institutions can expect access to the network in the first half of 2027.
At $214, the QNT price gives Quant a market value of $3.1 billion. It is still 43% below the September wick and half its $427 all-time high from September 2021.
DISCOVER: HSBC RedCoin Goes Live for 3.3M PayMe Users in Hong Kong
QNT Price Analysis: Can It Break $214?
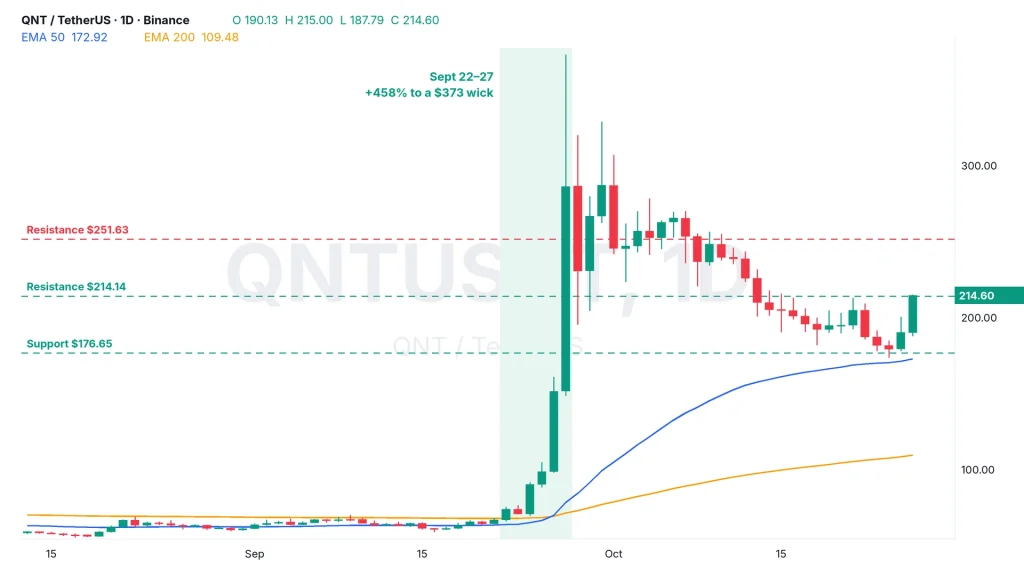
It’s testing it right now. Monday’s high of $215 sits right on the halfway mark of the whole summer rally. That is the 0.5 Fibonacci retracement between the August 17 low of $55.28 and the $373 top, at $214.14.
The floor held where the chart said it should. Saturday’s low of $173.56 sat just under the 0.618 retracement at $176.65 and a few dollars above the 50-day exponential moving average (EMA), now $172.90. Buyers stepped in there, and the daily candle never closed below $179.
- The line: $212.87 to $215. The October 21 high, the 0.5 retracement and Monday’s high. QNT has not closed a day above $210 since October 12.
- Next up: $251.63. The 0.382 retracement, close to the $256.50 high from October 9.
- The floor: $172.90 to $176.65. The 50-day EMA and the 0.618 retracement, tested on Saturday.
- Below the floor: the 200-day EMA at $109.50, far away, with very little trading history in between.
EXPLORE: Support and Resistance in Plain English: Floors, Ceilings and Why They Work
Three ways this plays out:
- Bull case: a daily close above $214 turns the halfway mark into support and opens $251.
- Base case: QNT chops between $190 and $214 until the Fed decision on Wednesday at 18:00 UTC (2:00 p.m. in Washington).
- Bear case: the bounce fades on thin volume and QNT retests $173 to $177 at the 50-day EMA.
The Fear & Greed Index reads 50, neutral. The fundamentals story hasn’t changed since September; the chart has. QNT bounced exactly where buyers defended it and is now leaning on the halfway line. A daily close above $214 is what turns a quiet bounce into a trend change.

On the climb since 2017. Trades futures and reads onchain data. Automates the boring parts.
More from VikingXBT →