The short version
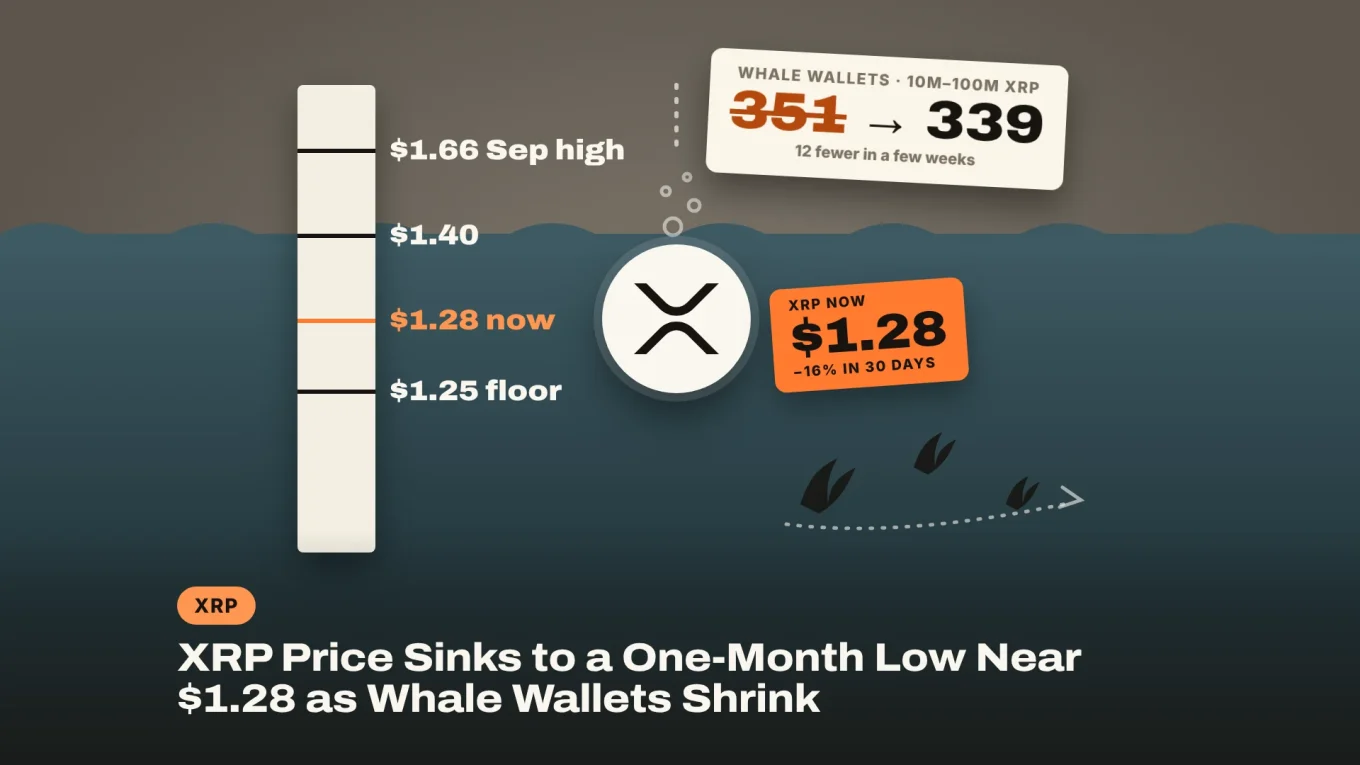
- XRP price slid to $1.28, below every daily close since mid-September and 16% lower than a month ago, while Bitcoin lost under 5%.
- Wallets holding 10 million to 100 million XRP fell from 351 to 339 in a few weeks (Santiment), and the 50-day EMA crossed under the 200-day on October 22.
- The crew is watching $1.25, tested three times since September 16, and the Fed decision on Wednesday at 18:00 UTC.
The XRP price is leaking lower while the rest of the market treads water. XRP trades at $1.28 at the time of writing (08:30 UTC), below every daily close since mid-September and about 16% under where it stood a month ago. Bitcoin has lost under 5% over the same stretch.
Saturday’s wick to $1.2546 on Binance was the lowest XRP price since mid-September, and buyers have defended the $1.25 area three times now. At the same time, some of the biggest XRP holders appear to be trimming. So is $1.25 a floor, or just the next level to go?
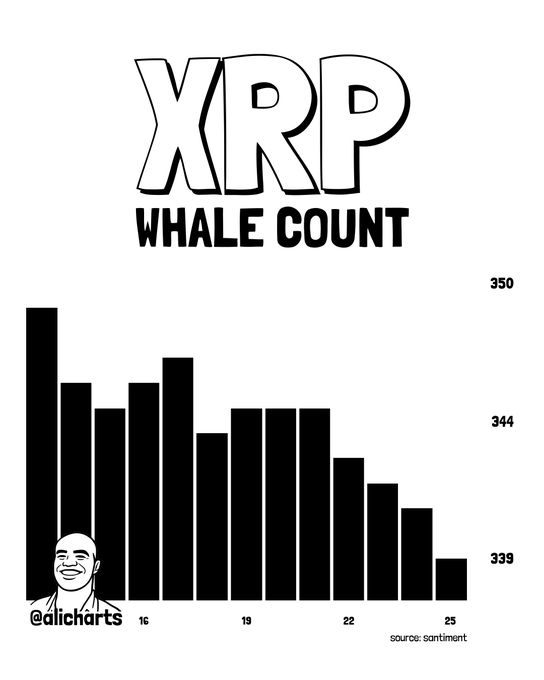
Analyst Ali Martinez flagged the whale side of the story on Saturday:

2/5 Some of the largest whales on the XRP Ledger appear to be reducing their exposure.
The number of wallets holding between 10 million and 100 million $XRP has fallen from 351 to 339 over the past few weeks.
That decline raises the possibility of growing selling pressure.
Why Is the XRP Price Falling?
Because the September rally ran out of buyers, and October has been one lower high after another. XRP topped at $1.6581 on September 23, broke down on October 7 with a drop to $1.42, and has not closed a day above $1.40 since October 11.
The last bounce was short. XRP climbed to $1.3992 on October 21 and gave it all back within two days. XRP has closed under $1.31 every day since, and the dips keep landing near $1.25: $1.2562 on October 18, then $1.2546 on Saturday as Bitcoin broke below $80,000.
The bigger picture is worse. XRP is down 30% this year and about 51% lower than a year ago, when it traded at $2.65. It is 65% below its $3.65 all-time high from July 2025.
Sponsored · Affiliate link
Save 20% on fees trading on WEEX
Base Camp may earn a commission if you sign up. It never affects what we write.
Are XRP Whales Selling?
Some of them appear to be. XRP whales are thinning out: Santiment data shared by Ali Martinez shows wallets holding between 10 million and 100 million XRP fell from 351 to 339 over the past few weeks. At $1.28, each of those wallets holds roughly $13 million to $128 million of XRP.
A wallet dropping out of that group doesn’t prove it sold. Big holders often split coins across new addresses, move them to custody, or send them to an exchange to sell later. That is the caveat. Still, 12 fewer large wallets during a month-long slide is not what a bottom usually looks like.
The supply side has a date on it too. Ripple’s monthly escrow releases 1 billion XRP on November 1, and for the past 22 months about 700 million of it has gone straight back into new escrows. The market knows the routine, so it rarely moves the price much on its own.
Then there’s the Fed. The rate decision lands on Wednesday, October 28, at 18:00 UTC (2:00 p.m. in Washington), and risk assets like XRP tend to wait for it.
DISCOVER: XRP Escrow Unlock: 1 Billion Opens Nov 1, 700 Million Usually Goes Back
XRP Price Analysis: Can $1.25 Hold?
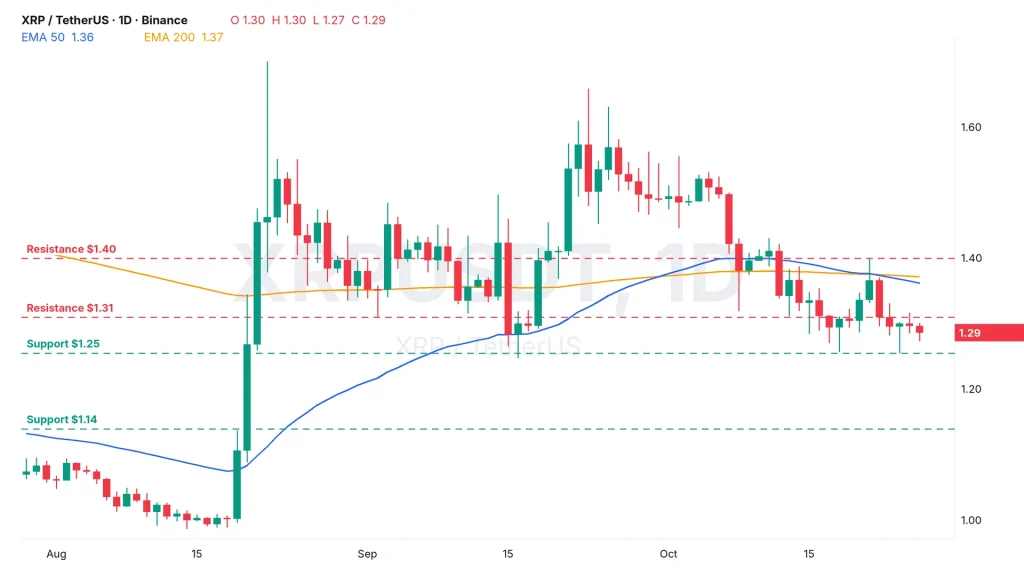
For now, yes: $1.25 is the XRP support that has held all month, but the trend is against it. The 50-day exponential moving average (EMA) slipped under the 200-day EMA on October 22, a death cross. The golden cross before it, on October 1, lasted just three weeks.
- The floor: $1.2468 to $1.2562. The September 16 low and the two October lows. A daily close under $1.25 would be the lowest since August 19, before the summer breakout.
- The first ceiling: $1.3094. The October 22 close. XRP has closed under it every day since.
- The trend line: $1.36 to $1.37. The 50-day EMA ($1.3617) and the 200-day EMA ($1.3714). Above them, $1.3992 and then $1.4835.
- Below the floor: $1.1389, the 0.786 Fibonacci retracement of the August-to-September rally, then $1.05, where that rally started.
EXPLORE: Indicators Worth Knowing: Moving Averages, RSI and Volume
Three ways this plays out:
- Bull case: a daily close above $1.31 brings the EMAs at $1.36 to $1.37 back into play, then $1.3992.
- Base case: XRP chops between $1.25 and $1.31 until the Fed decision on Wednesday.
- Bear case: a daily close under $1.25 opens $1.14, and the August breakout zone near $1.05 after that.
The Fear & Greed Index reads 50, neutral. XRP has held $1.25 three times, but each bounce has been smaller than the last, from $1.66 in September to $1.40 and then $1.32. With the big wallets stepping back, the fourth test may not need much of a push.

In crypto since 2017. A technical trader with years of experience in DeFi and onchain data.
More from TANG →