
The short version
- Bitcoin 200-week moving average: BTC trades at $64,848, about 4.9% under the line at $68,194 after a 12.7% weekly drop, with Fear and Greed at 12.
- VanEck’s Matthew Sigel says past cycles hit their final capitulation at this line, and his SpaceX IPO analog puts the near-term low in early December.
- The last full break, in June 2022, bottomed 23 weeks later at $15,476, almost 25% under the first close below the line.
- Next: Anthropic prices its IPO on Thursday, November 19; day 18 after that, Sigel’s SpaceX marker for the low, is Monday, December 7.
“The near-term low may still be ahead in early December.” That’s VanEck’s read on Bitcoin after a week that took it straight through the line where past bear markets ended.
Bitcoin trades at $64,848 at the time of writing, about 4.9% under the Bitcoin 200-week moving average at $68,194 on Binance’s weekly closes. Last week ran from $74,851 to $65,351, a 12.7% drop, and the Crypto Fear and Greed Index sits at 12. So is this the floor that past cycles bottomed on, or is the floor still a few weeks away?
VanEck posted the call on Monday, quoting its head of digital assets research, Matthew Sigel:

Bitcoin is retesting its 200-week moving average, where past cycles hit their final capitulation. The near-term low may still be ahead in early December.
Why VanEck Points to Early December
Because of an IPO. In his note, Sigel says the Anthropic IPO, pricing on November 19 at a reported $1.4 trillion valuation with an estimated $64 billion raise, “appears to be acting as a capital vacuum,” the same thing he saw around the SpaceX listing. We already covered the deal and the whale betting against it, so here is only the part that matters for Bitcoin.
Sigel calls the SpaceX analog instructive. Bitcoin fell roughly 19% in the 50 days before that IPO, bottomed about 25% down around day 18 after the listing, then rallied hard near day 70. Count 18 days from November 19 and you land in the first week of December. That is where his “early December” comes from.
The chain he describes goes like this:
- Money leaves for the IPO: a $64 billion raise pulls cash out of other risky trades, and Bitcoin is one of the easiest to sell.
- Leverage gets flushed: more than $1.3 billion of leveraged longs were liquidated on November 13 and 14, and perpetual funding rates turned negative, so shorts now pay longs.
- US buyers step back: the Coinbase premium is at its deepest discount in over two years, which Sigel reads as the basis trade unwinding and US hedge funds on the sidelines or net short.
- Less dry powder: stablecoin supply shrank by roughly $14 billion to $20 billion over the past month.
Sigel’s full post, with his charts:

Bitcoin is down approximately 6% from Friday’s close and 24% from its pre-election high, having breached both the 200-day moving average at $73,000 last week and, now, the 200-week moving average near $68,900, with spot settling around $65,000. Worth noting: comparable 200-week
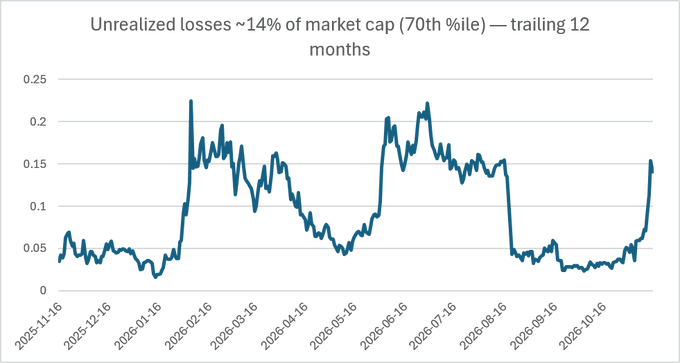
He also names a credit worry. Jensen Huang has left NVIDIA, and Sigel expects the interim chief to scale back the chipmaker’s $500 billion AI financing program while Bitcoin’s correlation with the Nasdaq sits near multi-year highs.
One IPO is a sample of one, though, and Sigel frames it that way: “If the pattern holds.”
Sponsored · Affiliate link
Save 20% on fees trading on WEEX
Base Camp may earn a commission if you sign up. It never affects what we write.
Bitcoin 200-Week Moving Average: What Happened Last Time?
The low came later, and lower. The 200-week moving average is the mean of the last 200 weekly closes, almost four years of prices, which is why it lines up with the four-year cycle. Sigel points to late 2022 and the first half of 2023 as the comparable retests, “marking the final capitulation phase before the four-year cycle turned higher.”
On Binance, the 2022 break came in the week of June 13. Bitcoin fell from $26,575 to a $17,622 low that week and closed at $20,574, under the line. It didn’t bottom there. After the FTX collapse it hit $15,476 in the week of November 21, 23 weeks after the break and almost 25% below that June close. Bitcoin climbed back to the line in early 2023 and tested it again in the first half of the year before the next bull run.
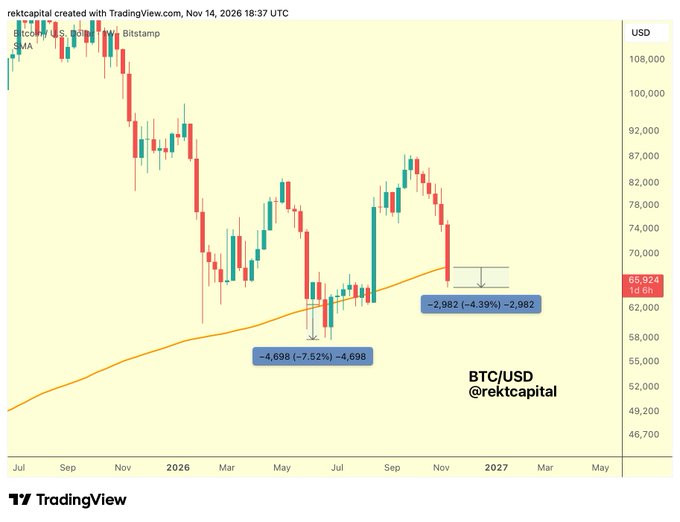
This year already had a dress rehearsal. In June, Bitcoin dipped to $58,115 and closed the week of June 22 at $59,577, under the 200-week line. It made the year’s low of $57,800 days later, and by late September it traded above $87,000. In other words, the Bitcoin 200-week moving average has bent under the price once in 2026 already without breaking. Rekt Capital put the two dips side by side on Saturday:

#BTC
Bitcoin has now tagged the 200-week SMA for the second time in this cycle
In the Summer, Bitcoin deviated only -7.5% before reversing to the upside towards ~$87000
Now, Bitcoin has begun yet another deviation below the 200-week SMA which is currently just over -4% deep
SIDE TRAIL: Bitcoin Options: $60K Puts Now Rival the $80K Call as Deribit’s Biggest Bet Before the Nov 27 Expiry
The difference now is positioning. Sigel lists the signals in the same post, and they point two ways:
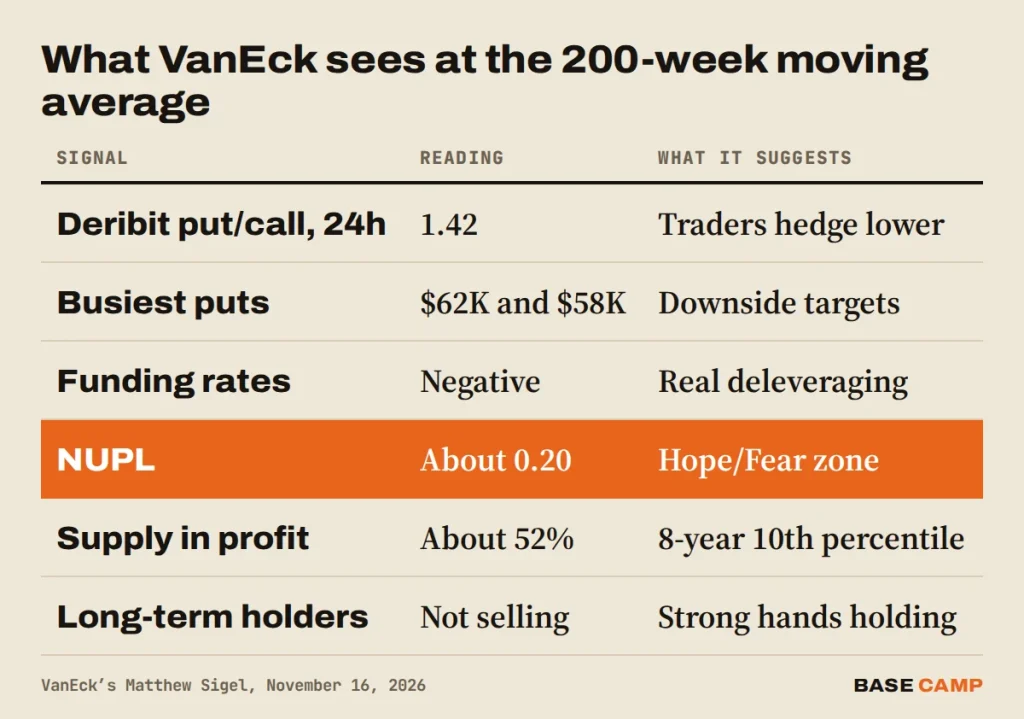
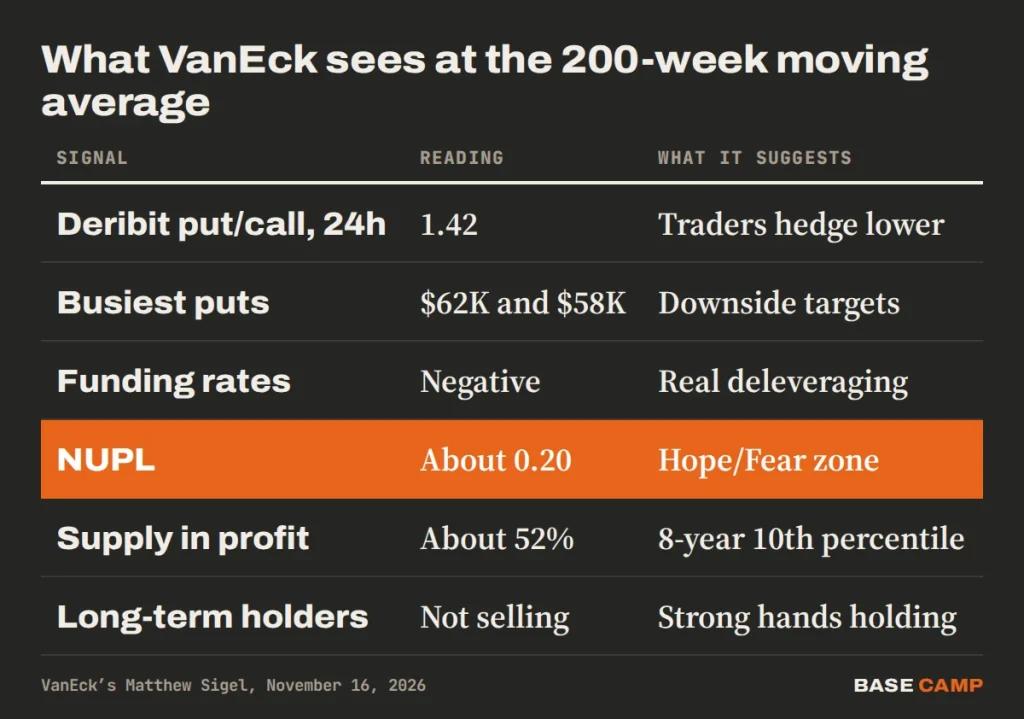
The options and futures side is bearish. The on-chain side looks more like the late stage of Bitcoin capitulation: NUPL, the share of Bitcoin’s market value that is unrealized profit, is near 0.20, and realized losses crossed above realized profits for the first time since August. Coins held three to five years are moving into the five-to-seven-year group rather than being sold. Sigel calls that “distribution by weak hands and accumulation by strong ones.”
Bitcoin Price Analysis: Where Are the Levels to Watch?
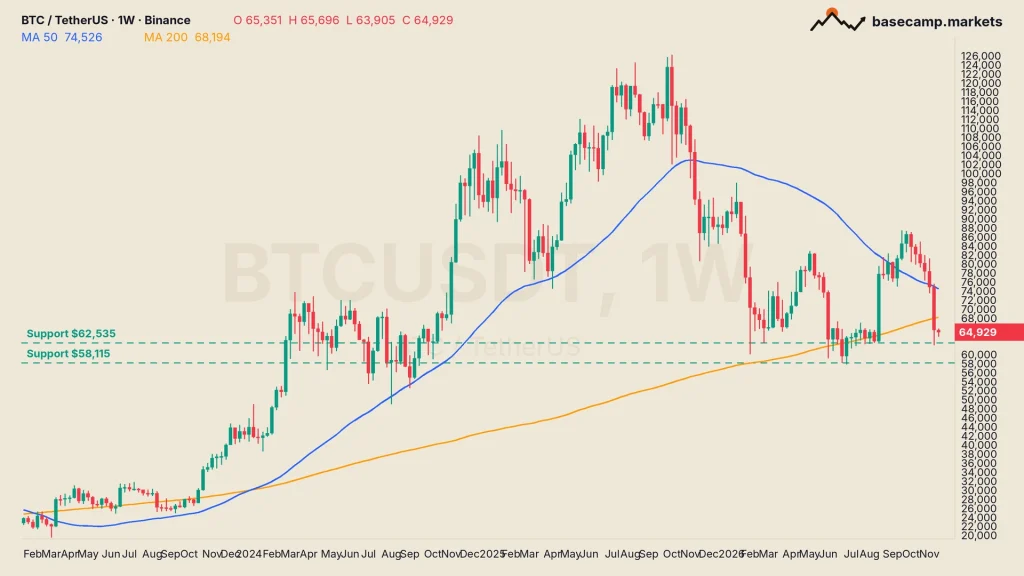
Under the 200-week average for now, with the June lows as the next real floor. The line sits at $68,194 on Binance’s weekly closes; Sigel put it near $68,900, and the gap comes down to the exchange and the closes each chart uses. The 50-week average is far above, at $74,526, and the daily 200-day average is $72,854, close to the $73,000 Sigel says Bitcoin lost the week before.
The areas to watch, each with its condition:
- $68,194: the 200-week moving average. A weekly close back above it would turn this into a June-style dip, not a break.
- $65,474 to $66,956: the nearest swing highs, the first area sellers have defended this week.
- $62,006 to $62,535: last week’s low and the August low. It is also where the busiest Deribit puts sit, so a drop there could get crowded.
- $57,800 to $58,115: the June lows and the year’s bottom. A weekly close under them would mean the June floor failed.
Altcoins took the same hit, only harder. Ethereum trades at $1,813.67, down 13.3% in seven days, and Solana at $73.45 is down 29.3% over 30 days, against 20.9% for Bitcoin.
TRAIL MAP: Indicators Worth Knowing: Moving Averages, RSI and Volume
Anthropic prices on Thursday, November 19. If Sigel’s SpaceX map holds, day 18 after that falls on Monday, December 7.

Teddy has been trading crypto since 2016. The focus is altcoins and EMA setups: finding coins sitting on key levels, waiting for support to hold or a range to be reclaimed, and trading the move from there. Bitcoin sets the tone, but the opportunities are usually in the alts.
More from Teddy