
The short version
- Bitcoin ETF outflows hit $582.3 million on November 19, the worst day of the month for the twelve US spot funds.
- BlackRock’s IBIT lost $541.1 million, 92.9% of the day, while Morgan Stanley’s MSBT took in $49.6 million.
- November’s outflows reach $3.47 billion, 6.7 times October’s, and Ethereum ETFs are at $972.6 million out after losing $131.2 million.
- Next: whether BTC, near $61,700 after its lowest price since July, holds the $59,131 area while the funds keep selling.
Bitcoin ETF outflows came almost entirely through one door on Thursday, November 19. BlackRock’s IBIT lost $541.1 million of the $582.3 million that left the twelve US spot funds, the worst day of November. The month’s earlier low mark, $430.2 million on November 5, is no longer close.
IBIT made up 92.9% of the total, and the other eleven funds lost only $41.2 million between them. Bitcoin, meanwhile, slid to its lowest price since early July.
So who is selling, and does it matter that it is mostly one door?
Farside’s Thursday post lists every fund:

𝗕𝗶𝘁𝗰𝗼𝗶𝗻 𝗘𝗧𝗙 𝗙𝗹𝗼𝘄 (𝗨𝗦$ 𝗺𝗶𝗹𝗹𝗶𝗼𝗻) – 2026-11-19
TOTAL NET FLOW: -582.3
IBIT: -541.1
FBTC: -45.9
BITB: 0
ARKB: -31.3
BTCO: 0
EZBC: 0
BRRR: 0
HODL: 0
BTCW: 0.3
MSBT: 49.6
GBTC: -13.9
BTC: 0
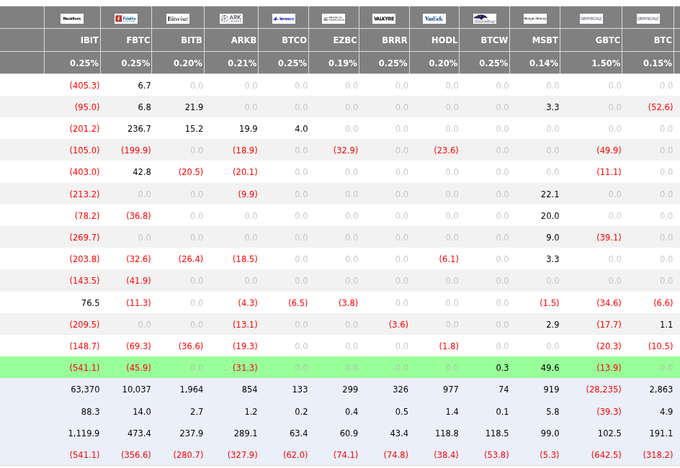
IBIT Sold, Morgan Stanley’s MSBT Bought
Behind IBIT, Fidelity’s FBTC lost $45.9 million, ARK’s ARKB $31.3 million and Grayscale’s GBTC $13.9 million, per Farside. Going the other way, Morgan Stanley’s MSBT took in $49.6 million, and WisdomTree’s BTCW added $0.3 million. The other six funds reported zero.
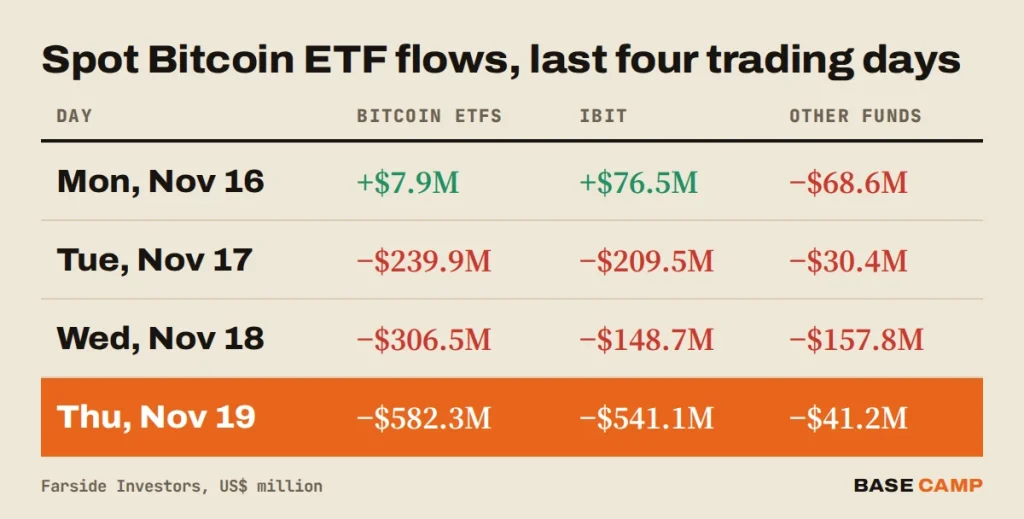
That is the opposite of Wednesday, when IBIT was less than half of $306.5 million in Bitcoin ETF outflows and Fidelity and Bitwise did much of the selling. Four sessions this week now add up to $1.12 billion out, after a small $7.9 million inflow on Monday.
Sponsored · Affiliate link
Save 20% on fees trading on WEEX
Base Camp may earn a commission if you sign up. It never affects what we write.
What Do $3.47B of Bitcoin ETF Outflows Mean for BTC?
They mean steady selling pressure that has not let up for three weeks. November’s total reaches $3.47 billion over 14 sessions, 6.7 times the $515.9 million that left in all of October. Only two days this month were green, November 4 and November 16.
The chain is simple enough:
- ETF holders redeem shares, and the bitcoin behind them is sold or handed to dealers to cover it.
- That selling meets a market already in extreme fear, so buyers step back instead of stepping in.
- A weaker price then gives the next holder one more reason to leave.
IBIT carries most of it. The fund has lost about $2.94 billion this month, roughly 85% of the total. That cuts both ways. One big seller can stop as quickly as it started, while selling spread across many funds would be harder to wave away.
SIDE TRAIL: Bitcoin ETF Outflows Hit $306.5M, Worst Day Since Nov 6, as FBTC and BITB Sell Alongside IBIT
Ethereum ETFs Lose $131.2M
The Ethereum funds had a rough day too. They lost $131.2 million on Thursday, per Farside’s Ethereum post, and BlackRock’s ETHA was $124.2 million of it. Grayscale’s ETHE lost $5.2 million and ETHB $1.8 million; the rest were flat.
That takes November’s Ethereum ETF outflows to $972.6 million, a whisker under $1 billion and the month not over yet. ETH trades at $1,731 at the time of writing, down 3.8% in 24 hours.
Bitcoin Price Analysis: Where Is the Area to Watch?
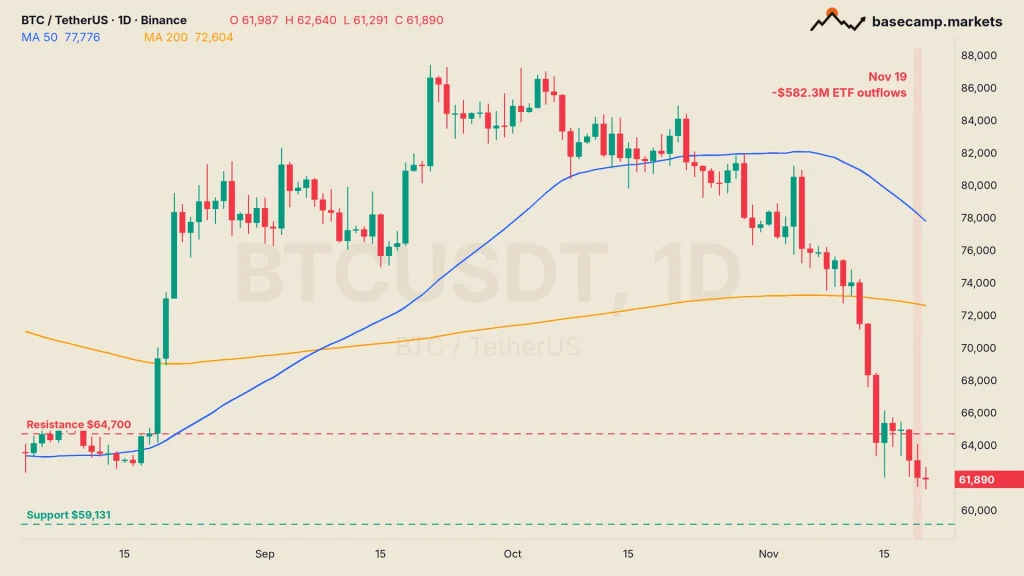
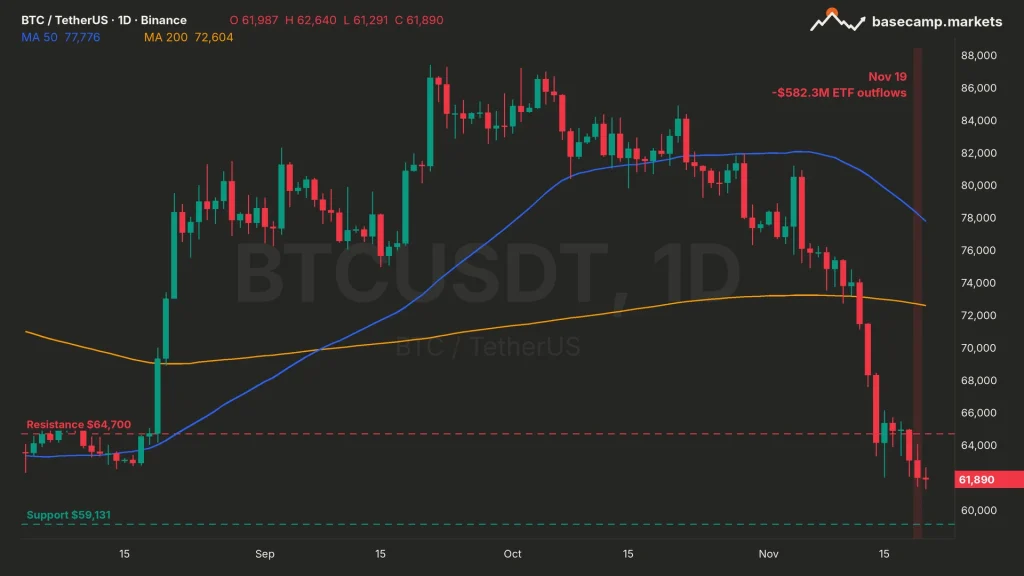
The area to watch is $59,131, the next swing low under the price. The BTC price is $61,682 at the time of writing, down 2.6% in 24 hours, after a dip to $61,291 on Binance, the lowest since July 3.
The 200-day moving average sits at $72,604, about 18% above the price, so the bigger trend still points down. The levels:
- Resistance: $64,700, then the 200-day MA at $72,604.
- Support: $59,131, then $58,115.
TRAIL MAP: Bitcoin Capitulation: Glassnode Says $62K-$66K Is the Line, With $58.5K and $53.7K Below It
Fear & Greed reads 12, still extreme fear. If the funds keep selling at this pace and BTC closes a day under $59,131, $58,115 is next. A daily close back above $64,700 on a green flow day would be the first hint that the selling is being absorbed.

Teddy has been trading crypto since 2016. The focus is altcoins and EMA setups: finding coins sitting on key levels, waiting for support to hold or a range to be reclaimed, and trading the move from there. Bitcoin sets the tone, but the opportunities are usually in the alts.
More from Teddy