The short version
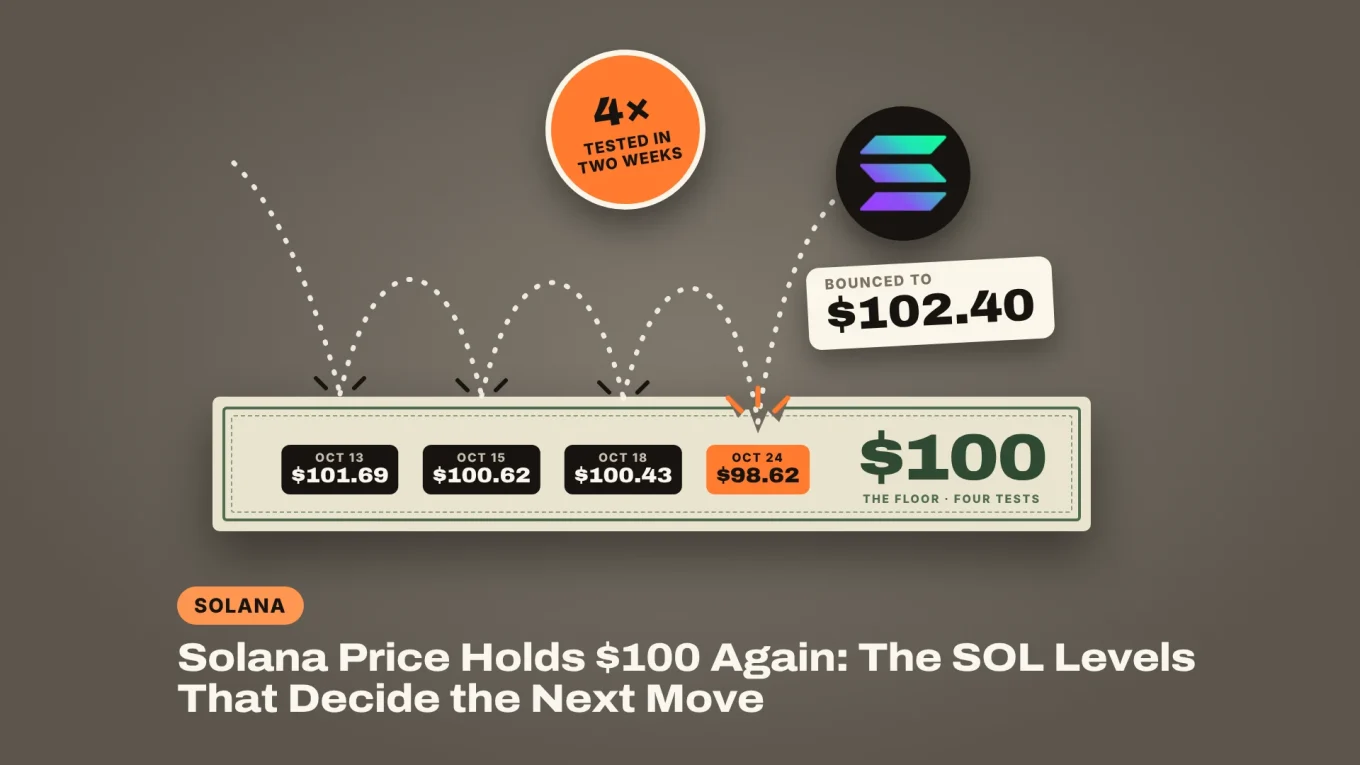
- Solana price dipped to $98.62 on Saturday as Bitcoin broke below $80,000, then bounced back above $100 within two hours and trades at $102.40.
- The $98 to $101 zone holds the 200-day EMA ($98.25), this month’s lows and a key Fibonacci level, but each test this month has gone a little deeper.
- The crew is watching a daily close above the 50-day EMA at $106.22, or below the 200-day EMA at $98.25, with OKX longs crowding in (long/short ratio 3.12).
The Solana price got pushed under $100 on Saturday and didn’t stay there long. SOL dipped to $98.62 on Binance when Bitcoin broke below $80,000, its lowest price since September 17, and was back above $100 within two hours. The SOL price is $102.40 at the time of writing, flat over 24 hours.
That makes four times in two weeks that sellers have tested the $100 area and walked away empty-handed. But each low has come in a little deeper, and SOL is still 18% below its September high. So how strong is this floor, and which levels matter from here?
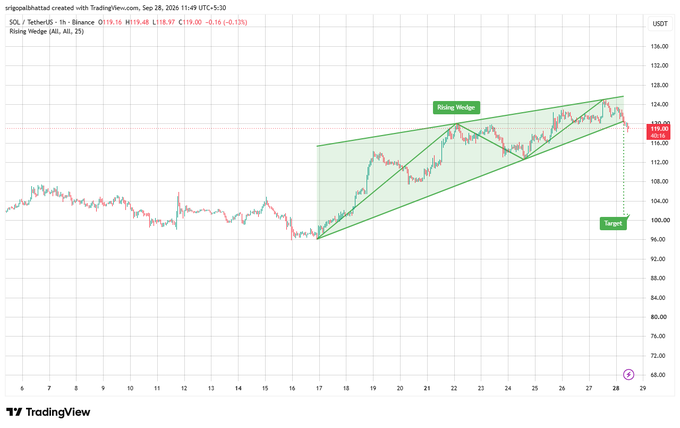
One trader drew the map back on September 28, the day SOL lost $120:

$SOL / Solana breaking down from a rising wedge formation 👀
Bears pushing price below the wedge support near $120 after a strong rally. Momentum shifting as sellers step in!
A breakdown could open the door toward $100, while reclaiming $120 may bring bulls back into the game
Why Is the Solana Price Stuck Near $100?
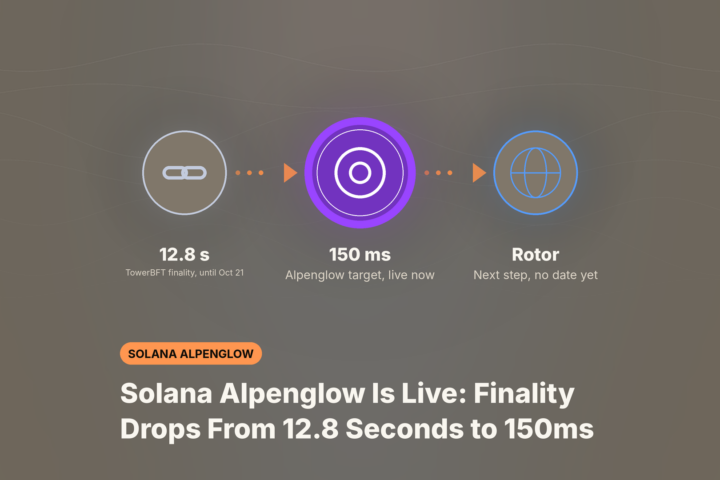
Because the good news is already in the Solana price, and Bitcoin is doing the steering. Solana’s biggest upgrade in years, Alpenglow, went live on October 21. SOL popped to $109.20 that afternoon. It has given back 6% since.
Then Bitcoin slipped. BTC broke its October 15 low on Saturday afternoon and fell to $79,221 on Binance, and SOL went with it, from $101.40 to $98.62 in about two hours. The difference was the recovery: SOL closed the day at $102.38, almost where it opened.
Zoom out and the picture is less friendly. SOL topped at $124.95 on September 27, broke down through $120 a day later, and every bounce since October 13 has stalled below $110. It is down 18% since January 1 and about 47% lower than a year ago.
Sponsored · Affiliate link
Save 20% on fees trading on WEEX
Base Camp may earn a commission if you sign up. It never affects what we write.
Is $100 Real Support for SOL?
Yes, and this SOL support is more than a round number. Three more things sit between $98 and $101 on the daily chart, and that is why the dips keep stopping there.
First, the lows. SOL bottomed at $101.69 on October 13, $100.62 on October 15 and $100.43 on October 18 before Saturday’s wick. Second, the 200-day exponential moving average (EMA), a trend line that weights recent prices more heavily, sits at $98.25. Saturday’s low stopped just above it, and SOL has closed above the 200-day EMA every day since August 21. Third, the 0.382 Fibonacci retracement of the June to September rally lands at $100.19.
The floor also has a track record. SOL closed above $100 on August 26 for the first time since February 2. Since then it has closed under $100 on only four days, all between September 10 and 16, and buyers took it back each time.
The last time $100 really broke, it broke hard. SOL closed at $97.89 on February 3, and three days later it traded at $67.50.
DISCOVER: Solana Alpenglow Is Live: Finality Drops From 12.8 Seconds to 150ms
What Are SOL Futures and Onchain Data Saying?
Futures are calm, and that cuts both ways. Open interest, the value of all open futures bets, held at about $360 million on OKX on October 24, inside the $345 to $370 million range of the past nine days. Saturday’s drop didn’t force a big unwind, and nobody piled in short either.
Funding rates are below normal. On OKX, the 8-hour rate averaged 0.0041% over the last ten days, under the 0.01% baseline, and on Hyperliquid it sits at about 0.001% an hour. Longs aren’t paying up to hold their bets.
The crowd is leaning long anyway. OKX’s long/short account ratio climbed to 3.12 on October 24 from 2.24 on October 18, so three accounts are now betting on a rise for every one betting on a fall. Those longs sit right above the floor, and that is where their stops sit too.
Onchain, Solana is quieter than it was a month ago. DefiLlama puts DEX volume on Solana at $13.0 billion over the past seven days, and 21.6% lower over the last 30 days than the 30 before. Stablecoins on the network have slipped to $15.84 billion, from $16.81 billion on October 6. Less money parked on Solana means less fuel for a bounce.
EXPLORE: Support and Resistance in Plain English: Floors, Ceilings and Why They Work
Solana Price Analysis: Which SOL Levels Matter Next?
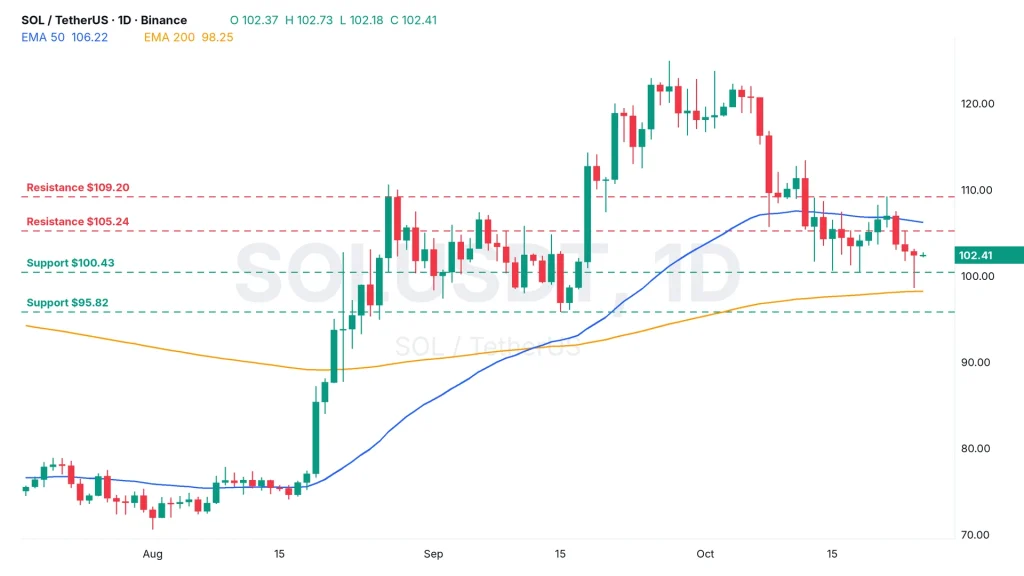
The floor is $98.25 to $100.43, and the ceiling is $105.24. The Solana price sits in the bottom third of a range it has traded in since October 13.
- The floor to defend: $98.25 to $100.43. The 200-day EMA and the October 18 low. A daily close under $98 would be the first under the 200-day EMA in two months.
- The first ceiling: $105.24. The October 23 high, with the 50-day EMA at $106.22 right above it. The 50-day has started to turn down.
- The breakout line: $109.20. The Alpenglow launch-day high. Above it, $110.60 and then $124.95.
- Below the floor: $95.82, the September 15 low, then the 0.5 Fibonacci level at $92.54.
Three ways this plays out:
- Bull case: a daily close above $106.22 clears the 50-day EMA and opens $109.20, then $110.60.
- Base case: SOL chops between $100 and $105 while Bitcoin decides what to do with $80,000.
- Bear case: a close under the 200-day EMA at $98.25 turns $100 into resistance and puts $95.82 and $92.54 in play.
The Fear & Greed Index reads 54, neutral. Solana has defended $100 four times this month, but each test has dipped a little lower. If Bitcoin closes a day under $80,000, the fifth test may be the one that sticks.

On the climb since 2017. Trades futures and reads onchain data. Automates the boring parts.
More from VikingXBT →