
The short version
- The order book shows resting limit orders (intent). CVD shows executed market orders (aggression). Both matter, but executed trades can’t be faked.
- Spot-led moves tend to last; perp-led moves with rising open interest and stretched funding tend to unwind.
- Absorption (heavy selling that doesn’t push price down) at a key level is one of the clearest signs a side is about to lose.
- Use this data to confirm or reject setups at levels you already marked, not to trade every wiggle.
Two Bitcoin rallies can look identical on a candlestick chart and be completely different underneath. One is driven by spot buyers stacking coins. The other is late longs piling into perps at 20x while shorts get squeezed. The first tends to hold. The second tends to give it all back.
The data that tells them apart is free: order books, cumulative volume delta, funding and open interest. This guide shows how to read them together. It builds on Funding rates and open interest from Ridge.
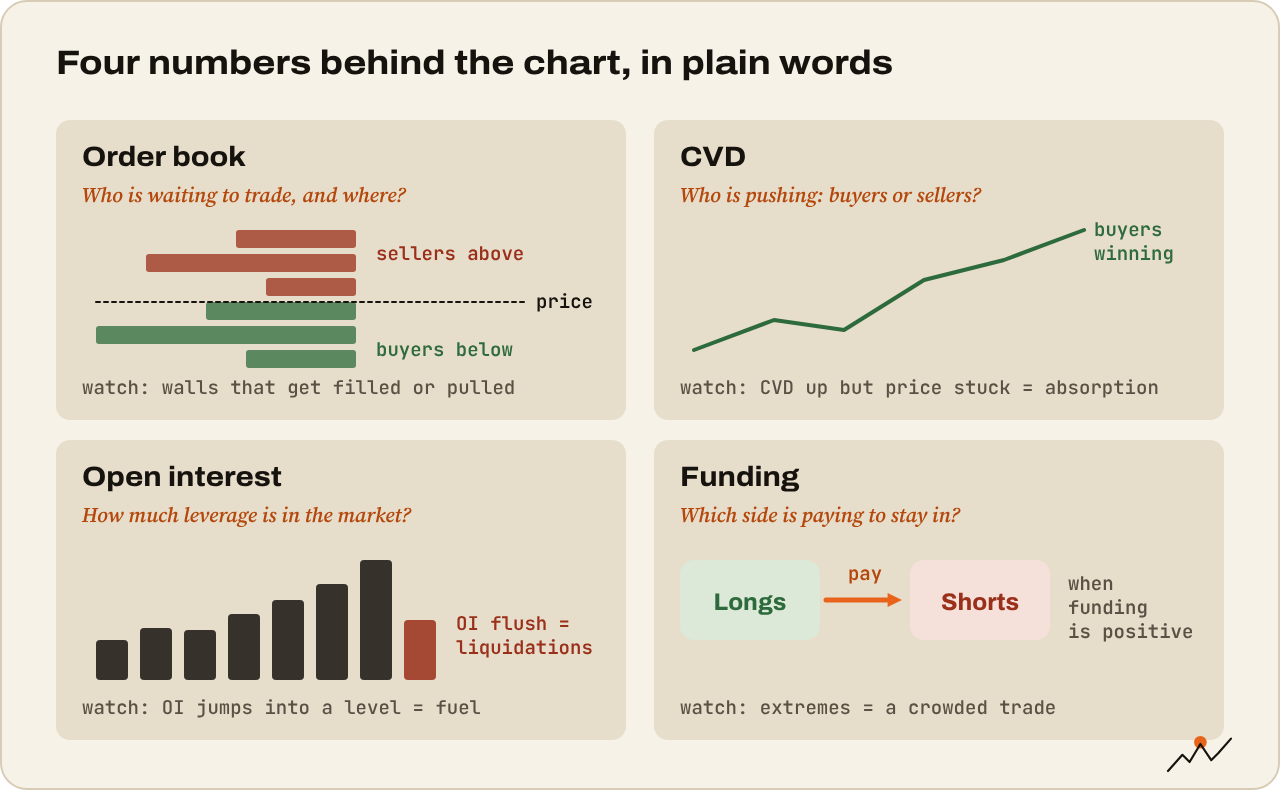
The order book: intent
An order book lists every resting limit order on an exchange:
- Bids: buy orders below the current price.
- Asks: sell orders above it.
- Spread: the gap between the best bid and the best ask.
- Depth: how much sits at each level. Often shown as “1% depth”: the total size of bids within 1% below price and asks within 1% above.
What to look for:
- Thin books (little depth near price) mean small orders move price a lot. Weekends, holidays and the hours after a crash are often thin. In October 2025, depth on major venues collapsed during the sell-off, which is part of why the move was so violent.
- Large walls: unusually big orders at one price. They can act as short-term support or resistance.
- Imbalance: much more depth on one side than the other.
The catch: resting orders are only intent. They can be cancelled in milliseconds. A huge bid wall that disappears just before price reaches it is spoofing, placed to make others believe in support. Treat walls as interesting, not as facts. Watch whether they get filled or pulled.
CVD: aggression
Market orders are where the real action is. They cross the spread and actually move price. Cumulative volume delta (CVD) tracks it: for each period, market buy volume minus market sell volume, added up over time.
- CVD rising: buyers are aggressive, lifting asks.
- CVD falling: sellers are aggressive, hitting bids.
The useful signals come from comparing CVD with price:
- Price up, CVD up: healthy. Aggressive buying is moving price.
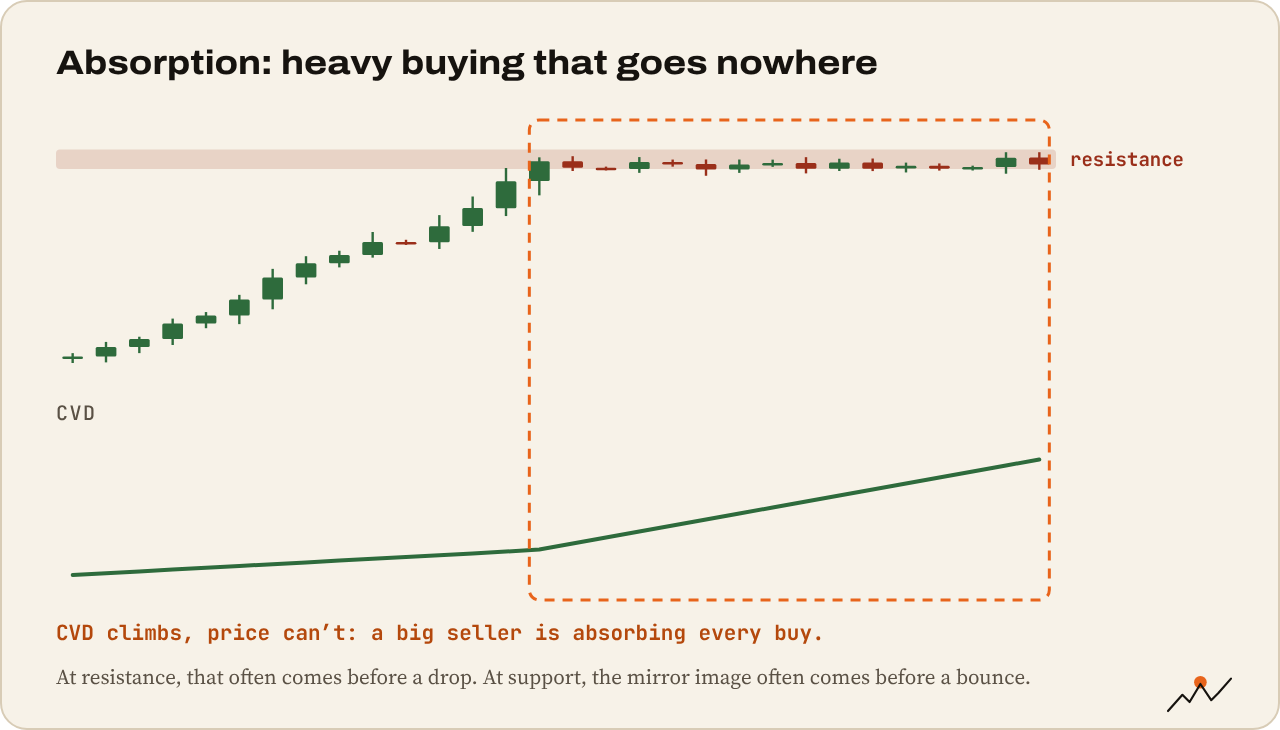
- Price flat or down, CVD up strongly: buyers are hitting the asks, but price won’t go up. Someone passive is selling into them: absorption by sellers. Bearish at resistance.
- Price flat or up, CVD down strongly: aggressive sellers can’t push price down. Passive buyers are absorbing. Bullish at support.
- New high in price, lower high in CVD: the push is losing aggression. A divergence worth noting.
Spot vs perps: who is driving?
Look at CVD separately for spot markets (Coinbase, Binance spot) and perpetual futures. Many data tools offer both.
- Spot-led rally: spot CVD rising faster than perp CVD. Real buyers taking coins. These moves tend to last, because nobody is forced to sell them later.
- Perp-led rally: perp CVD and open interest jumping, spot CVD flat. Leverage is driving. These moves tend to retrace when funding gets expensive or a dip triggers liquidations.
- Spot selling into a perp-led rally: a classic distribution signature.
A related gauge is the Coinbase premium: the gap between Bitcoin’s price on Coinbase (heavy US and institutional flow) and on offshore exchanges. A persistent premium suggests US spot demand; a discount suggests the opposite.
Funding and open interest, revisited
Layer on what you learned in Ridge:
- Open interest rising means new leveraged positions. Falling means positions closing or being liquidated.
- Funding shows which side is paying to hold: very positive means crowded longs, negative means crowded shorts.
- Basis: the premium of dated futures (like CME) over spot, annualized. A high basis means strong demand for leveraged longs; it also feeds the “cash and carry” trade institutions use.
None of these predict direction alone. Combined with CVD and price, they show who is trapped.
Liquidation heatmaps
A liquidation heatmap estimates where leveraged positions would be liquidated, based on open interest changes and common leverage levels. Bright bands are clusters of liquidation prices.
How to use them:
- Clusters are magnets: price often moves toward big clusters because that’s where forced orders wait (see liquidity sweeps).
- After a cluster is hit, liquidations spike and open interest drops. If price then stalls, the move may be done.
- They’re estimates. Exchanges don’t publish everyone’s positions. Treat bands as areas of interest, not exact prices.
Putting it together: four common pictures
| What you see | What it often means |
|---|---|
| Price grinds up, spot CVD leads, OI flat, funding neutral | Healthy spot demand. Pullbacks likely to be bought |
| Price spikes up, perp CVD and OI jump, funding very positive, spot CVD flat | Leverage-driven rally. Fragile; watch for a long squeeze |
| Price drops into support, perp CVD dives, OI rises, but price holds | Shorts piling into absorption. Fuel for a short squeeze |
| Sharp wick down, liquidations spike, OI drops hard, funding resets to neutral | Leverage flushed. Often a local bottom if price reclaims the level |
A practical workflow
- Start with your levels and bias from the chart. Order flow doesn’t replace multi-timeframe analysis; it refines it.
- As price approaches a level, check: is the move spot-led or perp-led? What’s funding? Is OI rising into the level?
- At the level, watch for absorption: aggressive orders that fail to move price.
- On the reaction, watch OI and liquidations. A sweep with an OI flush and a reclaim is a strong confirmation.
- Then use your normal entry rules, stop and size. Order flow informs the decision; it doesn’t change your risk rules.
Tip. Most of this data is available on CoinGlass, Velo, TradingView (some exchanges publish CVD and OI) and exchange order book views. Keep the dashboard small: price, spot and perp CVD, aggregated OI and funding cover most of it.
Watch out. Order flow is noisy and easy to over-read. Aggregated data lags, exchanges differ, and some volume is wash trading. Use it at levels you already planned to trade, and ignore it in the middle of nowhere.
Checklist at a key level
- Is the approach spot-led or perp-led?
- What are funding and OI doing into the level?
- Is there absorption: aggressive volume that isn’t moving price?
- Is there a liquidation cluster just beyond the level?
- After the reaction: did OI flush and did price reclaim?
- Does all of this agree with my higher-timeframe bias?
Where to go next
That finishes Reading the market. The next series zooms all the way out, to the four-year rhythm that has shaped every Bitcoin cycle so far: Bitcoin cycles and the halving.
