
The short version
- Risk/reward compares what you stand to lose (to your stop) with what you aim to make (to your target).
- Measure results in R: 1R is what you risk. A +3R win makes three times your risk.
- At 1:2 you only need to win a third of your trades to break even. At 1:3, a quarter.
- Expectancy (win rate × average win − loss rate × average loss) is the number that tells you if a strategy makes money.
New traders chase win rate. It feels good to be right, and every “90% accurate signals” channel knows it. But being right often and making money are two different things.
Some of the best traders in the world lose more trades than they win. They just lose small and win big. This guide shows you the math behind that, and how to use it on your own trades.
What risk/reward means
The risk/reward ratio compares two distances:
- Risk: from your entry to your stop-loss.
- Reward: from your entry to your take-profit target.
Example: you buy ETH at $3,000, with a stop at $2,850 and a target at $3,450.
- Risk: $3,000 − $2,850 = $150
- Reward: $3,450 − $3,000 = $450
- Risk/reward: 150 : 450 = 1:3
For every dollar you risk, you aim to make three. Traders also call this “3R.”
Our risk/reward calculator works it out from your entry, stop and target:
Base Camp tool
Risk/reward calculator
Compare what you can win with what you can lose, and the win rate you need to break even.
For learning only, not financial advice.
Thinking in R
“R” is a neat way to measure trades regardless of size. 1R is the amount you risked. If you risk $100 on a trade:
- hitting your stop is −1R (−$100);
- a win at 1:3 is +3R (+$300);
- closing early at break-even is 0R.
Thinking in R makes trades comparable. A +2R trade on a $500 account and a +2R trade on a $50,000 account are equally good trades. It also stops you from judging trades by dollar size, which is how emotion sneaks in.
The break-even win rate
How often do you need to win just to not lose money? It depends entirely on your risk/reward:
Break-even win rate = 1 ÷ (1 + reward/risk)
| Risk/reward | You break even if you win… |
|---|---|
| 1:0.5 | 66.7% of trades |
| 1:1 | 50% |
| 1:1.5 | 40% |
| 1:2 | 33.3% |
| 1:3 | 25% |
| 1:5 | 16.7% |
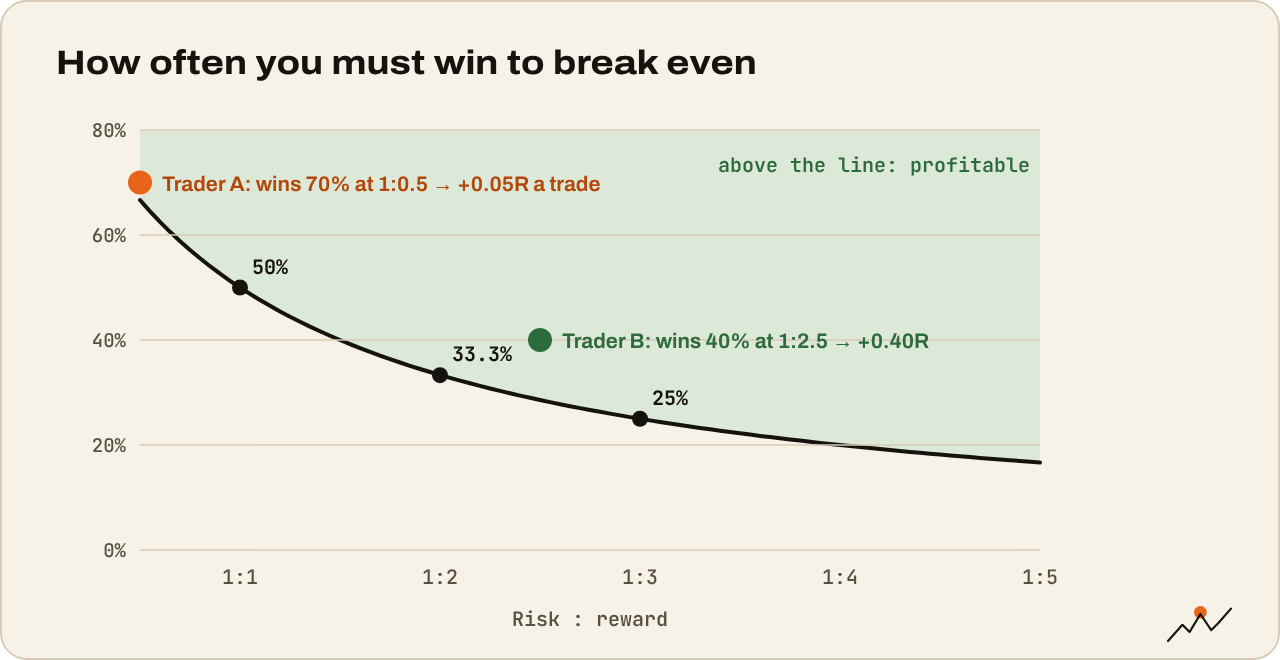
(Before fees. Fees push each number up a little.)
That table is the whole reason win rate matters less than you think. At 1:3, you can be wrong three times out of four and still not lose money.
Expectancy: the number that matters
To know whether a strategy actually makes money, you need its expectancy, the average result per trade:
Expectancy = (win rate × average win) − (loss rate × average loss)
Compare two traders, both risking 1R per trade:
- Trader A wins 70% of the time but takes profit quickly, averaging +0.5R per win.
Expectancy = (0.70 × 0.5) − (0.30 × 1) = +0.05R per trade.
- Trader B wins only 40% of the time but lets winners run to +2.5R.
Expectancy = (0.40 × 2.5) − (0.60 × 1) = +0.40R per trade.
Trader B makes eight times more per trade while being wrong most of the time. Over 100 trades risking $100 each, that’s about $500 for A and about $4,000 for B.
Now give Trader A slightly worse luck: a 65% win rate. Expectancy = (0.65 × 0.5) − (0.35 × 1) = −0.025R. The “70% accurate” style is one bad month away from losing money, because the margin for error is so thin.
Why a high win rate can hide a bad strategy
Many high-win-rate approaches work like this: take profit fast, but hold losers and hope. That gives lots of small wins and an occasional huge loss that wipes out months of them. It feels great right up until it doesn’t.
This is why “no stop-loss, it always comes back” is so dangerous. It produces a beautiful win rate until the one time it doesn’t come back.
But don’t chase giant ratios either
If 1:3 is good, isn’t 1:10 better? Not automatically. The further your target, the less often price gets there. A 1:10 setup that hits 5% of the time has negative expectancy: (0.05 × 10) − (0.95 × 1) = −0.45R.
The target has to be realistic. Look at the chart: where is the first level that could stop price? CryptoCred calls it the First Trouble Area. If a major resistance sits at 1.2R, your 3R target has to get through it first. A good trade has real room between your entry and the next obstacle.
Tip. A practical filter many swing traders use: only take a trade if the first realistic target gives at least 1:2. Below that, wait for a better entry closer to your stop, or skip it.
Making it work in practice
- Set stop and target before entry. Work out the ratio first. If it’s poor, don’t take the trade.
- Take partial profits. Many traders close part of the position at 1R or 2R and let the rest run with a stop at break-even. It lowers the average R per win a little but smooths results.
- Count fees. On a tight stop, a 0.1% fee each way can be a meaningful slice of 1R.
- Track your real numbers. Your planned R and your actual R are rarely the same. A trading journal shows you the truth.
Watch out. All of this assumes you actually honor your stops. One trade where you let −1R turn into −5R erases the profit of several good trades. The math only works if the losses stay at 1R.
Where to go next
You know how to size a trade and judge it. Now put it all on one page: Writing your own trade plan.
