
The short version
- Log every trade: setup, entry, stop, target, size, result in R, a screenshot and how you felt.
- Write the plan before you enter and the review after you exit. The gap between the two is where you learn.
- Once a month, add it up: win rate, average win and loss in R, expectancy, and which setups make money.
- Track mistakes as carefully as trades. Most traders find one or two habits cost them most of their losses.
Every trader thinks they know why they’re winning or losing. Then they start a journal and find out they were wrong. The setup they love loses money. The one they ignore pays the bills. And most of the damage comes from three trades a month they shouldn’t have taken.
A trading journal is the only way to see that. It’s not glamorous, and almost nobody keeps one for long. Which is exactly why it’s an edge.
Why bother?
Memory lies. You remember the big win and the painful loss, not the 30 ordinary trades that actually decide your results. You also remember your reasons as better than they were.
A journal gives you:
- Real numbers instead of a feeling, so you know whether your strategy works.
- Your patterns, like trading too much after a loss or cutting winners early.
- Proof for your plan. You can only improve a trade plan if you know which parts work.
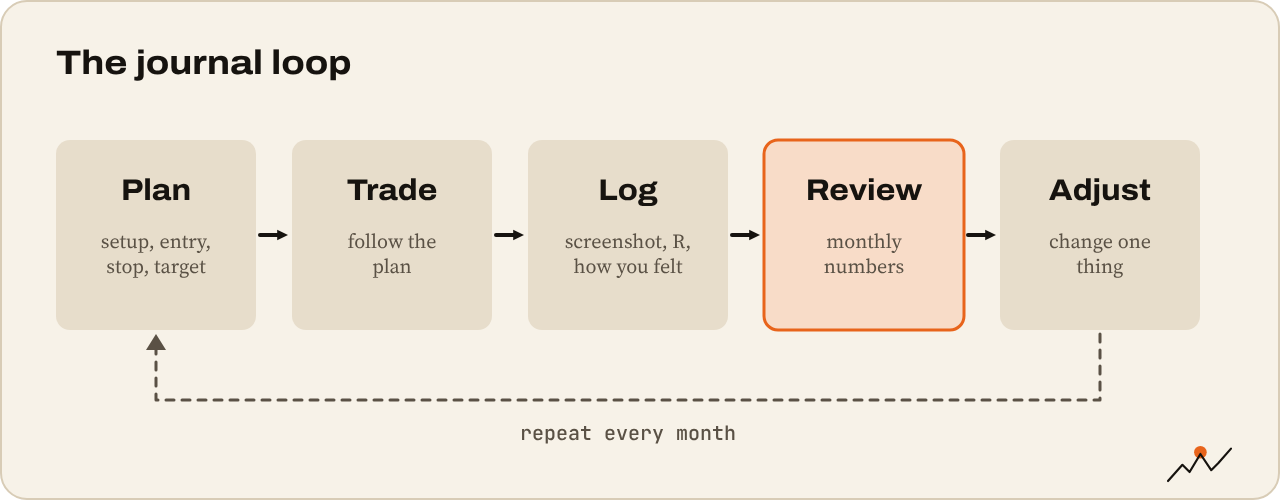
What to record for every trade
Before you enter:
- Date, time, market and direction (long or short).
- Setup: which setup from your plan this is. If it isn’t one, write that down too.
- Why, in one sentence. “Retest of daily support at $3,000 in an uptrend, 4h reclaim.”
- Entry, stop-loss and target, plus the planned risk/reward.
- Position size and risk in dollars and as % of the account.
- A screenshot of the chart with your levels marked.
- Your state: calm, rushed, bored, angry, tired, FOMO? One word is enough.
After you exit:
- Exit price, date and reason (stop, target, early exit, and why).
- Result in R and in dollars, after fees.
- Did you follow the plan? Yes or no, and where not.
- A second screenshot of how it played out.
- One lesson, if there is one. Often there isn’t, and that’s fine.
Tip. Trader Mayne’s What to Actually Write in Your Trade Journal covers the essentials in two minutes.
Where to keep it
Whatever you’ll actually use:
- A spreadsheet (Google Sheets, Excel, Numbers): flexible and free. One row per trade, one column per field above.
- A notes app with a template, plus screenshots. Easy on an iPad or phone.
- Journal software and exchange exports: many tools import trades from exchanges automatically. Handy for numbers, but you still need to add the why and the feelings yourself.
The best journal is the one you fill in after every trade, not the most detailed one you abandon after a week.
A simple spreadsheet layout
| Column | Example |
|---|---|
| Date | 2026-10-14 |
| Market / side | ETH / long |
| Setup | Support retest |
| Entry / stop / target | 3,000 / 2,850 / 3,450 |
| Risk ($ and %) | $100 / 1% |
| Planned R:R | 1:3 |
| Exit and reason | 3,300, closed early before CPI |
| Result (R) | +2.0R |
| Followed plan? | Yes |
| State before entry | Calm |
| Lesson | Early exit before news cost 1R. Fine by the plan. |
The monthly review
Once a month, set aside an hour. Work out:
- Number of trades.
- Win rate: winners ÷ total trades.
- Average win and average loss, in R.
- Expectancy: (win rate × average win) − (loss rate × average loss). Positive means the strategy made money per trade. See Risk/reward for the full explanation.
- Results by setup: which ones made money, which didn’t.
- Results by market, day of the week and time of day.
- Plan-followed trades vs rule-breaking trades: compare the results of each group. This is usually the eye-opener.
Then decide on one change for next month.
The patterns journals usually reveal
Every trader’s journal is different, but some findings come up again and again:
- Revenge trades: the trade taken right after a loss, to win it back. Often the worst-performing group.
- Boredom trades: taken during quiet markets because you wanted action.
- Cutting winners, holding losers: average win smaller than planned, average loss bigger.
- Overtrading on bad days: five trades on a day the first three lost.
- One setup doing all the work: and another one quietly losing money.
When you see one of these in your own numbers, it hits much harder than reading about it.
Watch out. Don’t only journal the trades you’re proud of. Skipped entries feel harmless, but a journal missing the worst 10% of your trades will tell you your strategy is better than it is.
Track mistakes like trades
Keep a separate mistakes list with a running cost:
| Mistake | Times this month | Cost |
|---|---|---|
| Moved stop further away | 2 | −3.1R |
| Entered without a setup | 4 | −2.4R |
| Traded after daily loss limit | 1 | −1.5R |
Many traders find their strategy is profitable and their mistakes are what make them lose. Fix the most expensive line first.
Where to go next
You’ve finished Build a trade plan. Next up, the Price action series, starting with the backbone of every chart: Market structure: trends, highs and lows.

On the climb since 2017. Trades futures and reads onchain data. Automates the boring parts.
More from VikingXBT →