
The short version
- October CPI lands on Tuesday at 13:30 UTC, the last inflation report before the Fed’s December 8–9 meeting, with the Cleveland Fed nowcasting 0.24% for all items and 0.21% for core.
- There’s no yearly rate this time: the BLS couldn’t collect October 2025 prices during the shutdown, so the monthly numbers are what the market trades.
- Bitcoin moved more than 1% in the four hours after three of the last four CPI reports, and fell 2.5% after September’s hot 0.6%.
- Next: core CPI against 0.2%, with Kalshi at 77% for a December hike. Follow Base Camp on X for the numbers as they land.
Bitcoin has spent five weeks looking for a reason to turn, and the next candidate is a single inflation number. The Bureau of Labor Statistics publishes the October CPI report on Tuesday at 13:30 UTC (8:30 a.m. in Washington), the last consumer inflation reading the Fed gets before its December 8–9 meeting. BTC goes into it at $74,200 at the time of writing, after a fifth red weekly candle in a row and a Sunday-night drop to $73,510.
Ethereum took the weekend worse. ETH trades at $2,105, down 5.67% in 24 hours and back under its 200-day average. Last week’s weekly close was Bitcoin’s lowest since mid-August, and the Fear & Greed Index sits at 29.
So does one inflation print still matter when traders already price a December hike at 77%? It does. Those odds have swung between 65% and 81% in the past week, and Tuesday’s number can push them either way.
Satoshi Flipper flagged it on Sunday: two inflation reports in one week, with producer prices on Friday.

Big week for inflation data incoming
CPI on Tuesday
PPI on Friday
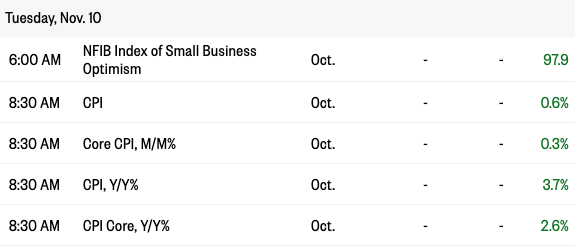
What Is Expected From the October CPI?
A cooler month than September, with both headline and core inflation seen around 0.2% to 0.3%. The Cleveland Fed’s inflation nowcast, a model that updates daily from oil and gasoline prices, puts October at 0.24% for all items and 0.21% for core, the index without food and energy.
Traders are leaning a little hotter. On Kalshi, there’s a 62% chance that headline CPI rises more than 0.2%. Core is close to a coin flip, with 47% odds it comes in above 0.2%.
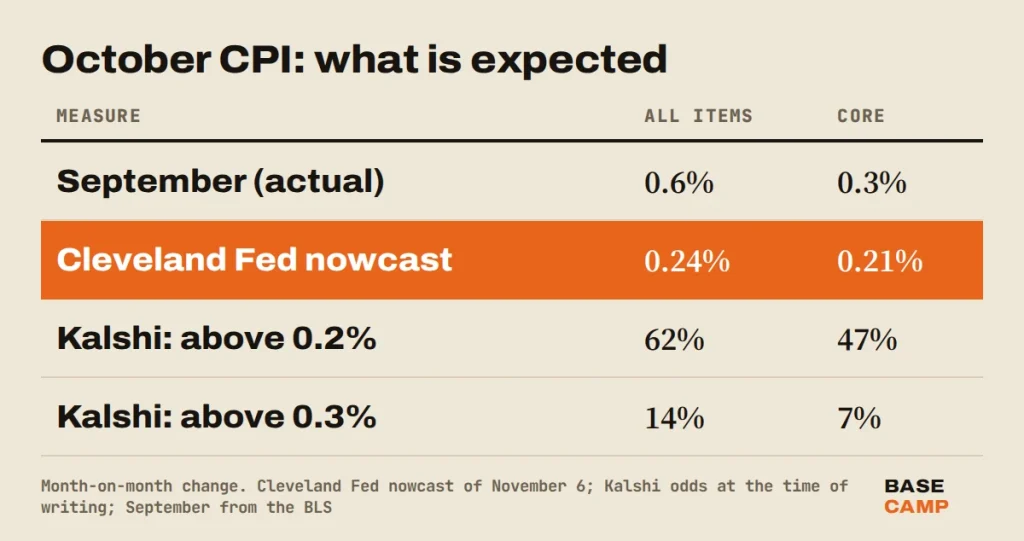
For context, September was hot. Prices rose 0.6% in the month, and gasoline alone jumped 9.1%, more than half of the whole increase. October had help at the pump. US gasoline averaged about $4.45 a gallon over the month in the Energy Information Administration’s weekly survey, roughly 1% below September’s $4.49.
That’s why the core number matters more on Tuesday. Cheaper gasoline should pull the headline down a little. Core shows whether rents, insurance and services are still running hot, and core rose 0.3% in both August and September.
Sponsored · Affiliate link
Save 20% on fees trading on WEEX
Base Camp may earn a commission if you sign up. It never affects what we write.
Why There’s No Yearly Inflation Rate This Time
Because the government shutdown in 2025 stopped price collection for October 2025, there’s nothing to compare October 2026 against. The BLS says it will not publish 12-month percent changes for October 2026 for the indexes where October 2025 data are missing, which covers most of them.
In other words, the familiar “inflation is 3.7%” headline won’t be in the report. September’s yearly rate was 3.7%, with core at 2.6%. Tuesday’s release gives the monthly changes, and those are what the market will trade.
Expect some yearly figures on X anyway. The Cleveland Fed’s own model estimates 3.74% for October, but that is a model, not a BLS number. If a post shows a yearly CPI rate at 13:30 UTC on Tuesday, check where it came from before you trade it.
How Did Bitcoin React to the Last Four CPI Reports?
More than it does on jobs day. Bitcoin moved more than 1% in the four hours after three of the last four CPI reports, and the biggest moves came with the most extreme prints: up 3% after June’s drop in prices, down 2.5% after September’s hot 0.6%.
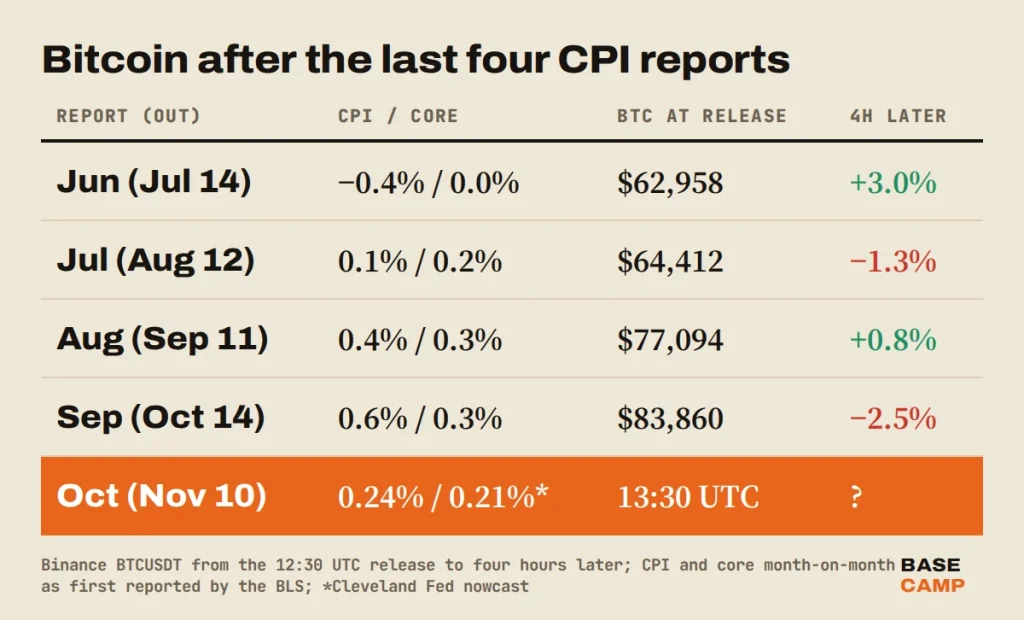
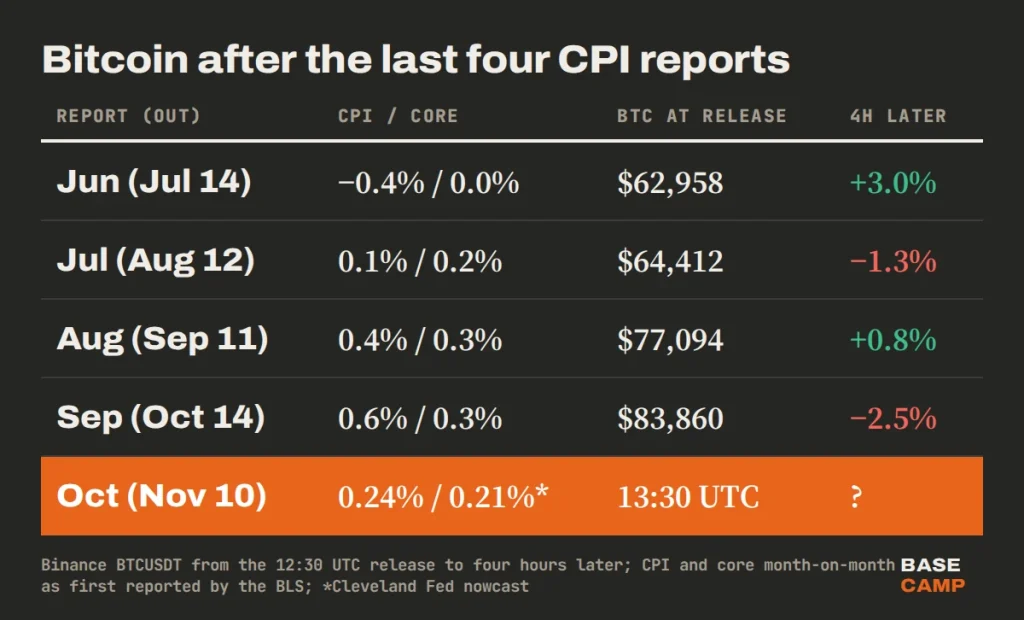
Two things stand out. The first hour is messy: after August’s report, Bitcoin swung across a 2.8% range within 60 minutes and still ended the afternoon up less than 1%. And a soft headline doesn’t guarantee a rally. July’s 0.1% came with a firmer core, and BTC slid 1.3%.
Compare that with payrolls. Before Friday’s report we found that Bitcoin moved less than 1% after three of the last four jobs reports. Inflation is the data this Fed is fighting, and the market treats it that way.
What the Print Means for a December Hike
It decides how sure the hike is. Kalshi prices a quarter-point December hike at 77% and a hold at 22%, up from 65% on Friday morning, before the US added 165,000 jobs against 65,000 expected. Kalshi posted the jump that evening:

Bond traders agree. The 2-year Treasury yield, the one that follows Fed expectations most closely, ended Friday at 4.51% in the Treasury’s daily data, up from 4.46% a day earlier. The dollar index rose to about 102 over the same stretch. Both tighten money for risk assets, and Bitcoin is one of them.
The line to watch is core at 0.2%. A core print at 0.2% or lower would be the softest since July and give the Fed a reason to wait, which would most likely pull the 2-year yield and the dollar lower. A third 0.3% in a row would point the other way: the hike would look close to certain, and Bitcoin would take that news about $9,000 lower than where it stood when September’s hot report hit.
There’s a timing twist too. Brent crude slipped under $100 last week on hopes of a US-Iran deal, and gasoline fell to $4.29 by November 2. That relief belongs to November’s CPI, though, and November’s report lands on December 10, the day after the Fed decides.
SIDE TRAIL: October Jobs Report: 165,000 Added, Hike Odds Jump to 78%
Bitcoin Price Analysis: Which Levels Matter Into CPI?
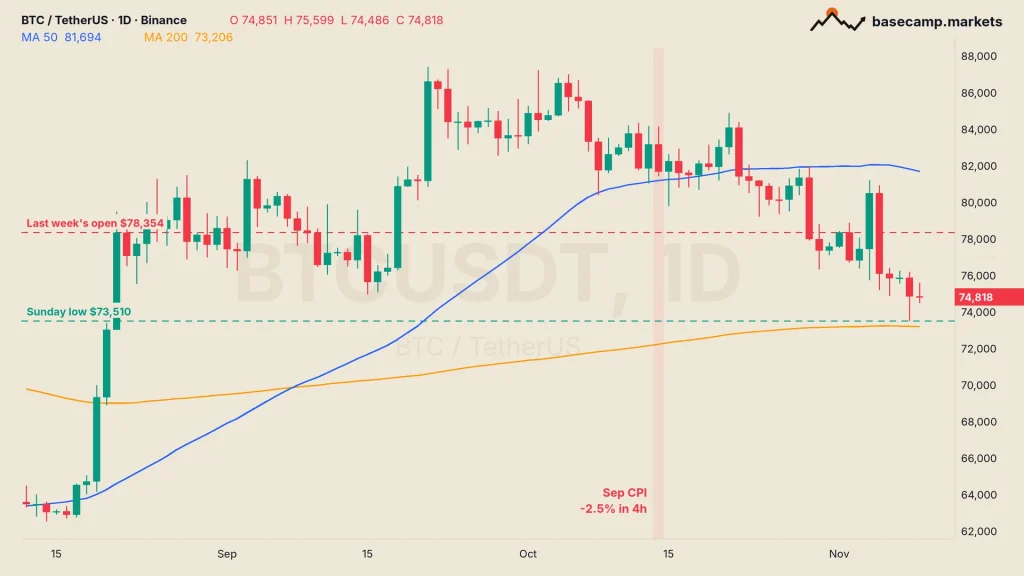
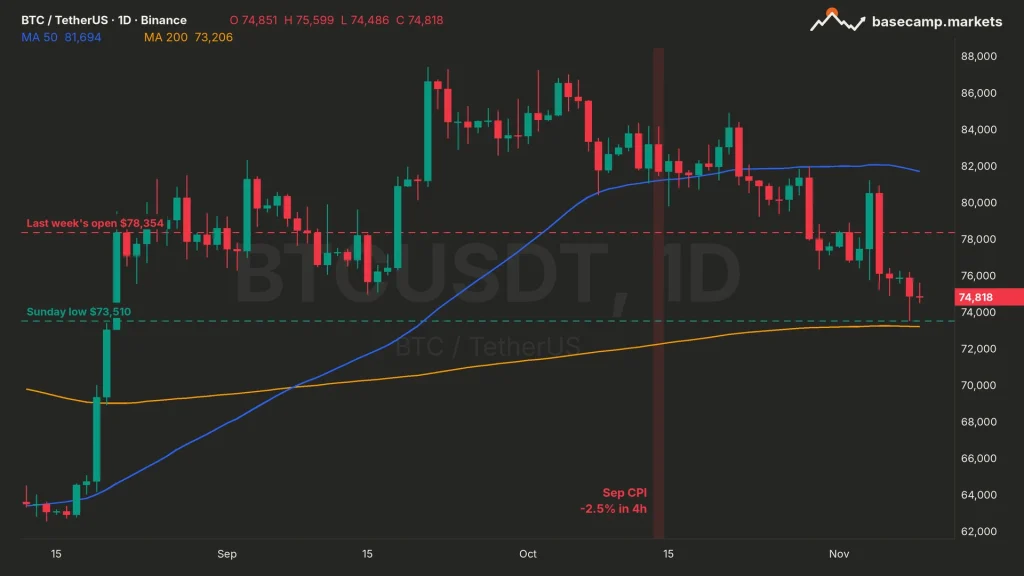
Two of them, both close. The Bitcoin price sits about 2% above Sunday’s low and about 5% below last week’s open, so a CPI move like June’s or September’s could test either side.
- The floor: $73,510, Sunday’s low on Binance and the lowest price since August 21.
- The big support: the 200-day moving average (MA), the average close of the last 200 days, at $73,206. Bitcoin has closed above it every day since August 19.
- The first ceiling: $78,354, last week’s open. Bitcoin broke above it on Wednesday and gave it all back on Thursday.
- The trend: the 50-day MA at $81,694, still above price and pointing down.
The daily RSI, a momentum gauge that runs from 0 to 100, reads 35.6. That’s weak but not yet oversold, the label traders give readings under 30. In plain words, sellers are in control but not exhausted, so there’s room to fall before the chart looks stretched.
What would confirm a turn: a soft core print and a daily close back above $78,354. What would cancel it: a hot core and a daily close below the 200-day MA, the first since August, which leaves $70,000 as the next round number. And the first hour after the release has been the noisiest part of the last four reports, so a spike at 13:31 UTC isn’t the answer yet.
TRAIL MAP: Risk Management: The 1% Rule and Position Sizing That Keeps You in the Game
Producer prices follow on Friday at 13:30 UTC, and November’s CPI arrives on December 10, one day after the Fed decides.

TANG has been trading crypto since 2017. The focus is technicals, DeFi and onchain data. On the chart, that means high-timeframe support, moving averages and momentum divergences. Onchain, it means regular checkups on where the data puts the cycle. TANG once ran CryptoJungle, a free community for researching and trading together, and brings that same spirit to Base Camp as one of its co-founders.
More from TANG