
The short version
- Bitcoin 50-week moving average: BTC closed the week at $74,851 on Binance, 0.9% under the line at $75,535, ending seven straight weekly closes above it.
- Galaxy’s Alex Thorn says the technical side of his bullish case holds if Bitcoin reclaims the line within a month, which in weekly closes means by December 6.
- History is mixed: three of the last five breaks were back above in a week, but December 2021’s quick reclaim still rolled into a bear market.
- Next: the average is sliding about $300 a week, to near $74,400 by December 6 if price goes sideways, so a flat month almost does the job.
Seven weeks. That’s how long Bitcoin stayed above its 50-week moving average before Sunday’s close knocked it back under.
BTC finished the week at $74,851 on Binance, 0.9% below the Bitcoin 50-week moving average at $75,535. It was the fifth red week in a row, which we counted down to on Sunday, and the first weekly close under the line since BTC won it back on September 20. Bitcoin trades at $74,200 at the time of writing. So is this the September reclaim failing, or a dip that history has forgiven before?
Galaxy’s head of research, Alex Thorn, posted the history less than two hours after the close:

bitcoin just closed below its 50 week moving average after holding above it for 7 consecutive weeks
two other times (2011-12 & 2019-20) btc closed below its 50w after reclaiming it post-bear bottom
neither of those times did the bear make a new lower low (weekly close data)
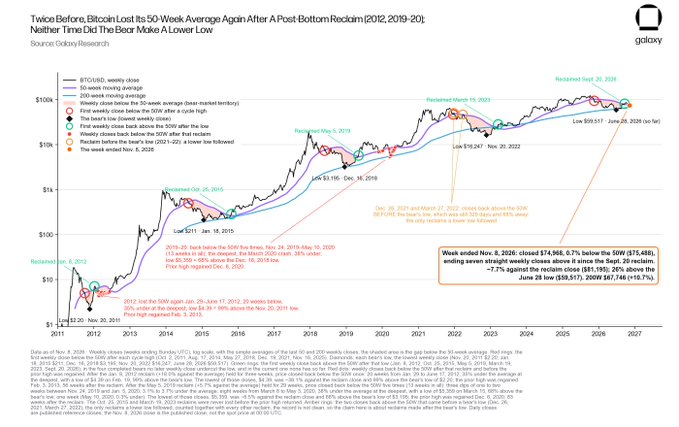
What Galaxy’s Alex Thorn Is Watching
A one-month window. Two weeks ago Thorn argued that technicals, fundamentals, positioning and sentiment all made it a good time to add and hold BTC, and the 50-week average was part of the technical side. In the same thread on Monday he wrote that this part “still holds if we go below 50w so long as it is reclaimed within a month.”
His reason is in the chart attached to the post. Since 2011, Bitcoin has reclaimed its 50-week average five times after a bear market’s low: in 2012, 2015, 2019, 2023 and now September 2026. Twice, in 2012 and 2019–20, it lost the line again before the old high came back. Neither time did the bear market go on to a lower weekly close.
Thorn flagged the weak spot himself. Five reclaims is the whole sample, and “bottom in” is only known in hindsight. For 2026 it means the June low holding: a $59,517 weekly close in Galaxy’s data, $59,577 on Binance. Sunday’s close sat about 26% above that, and 7.8% under the $81,178 close that won the line back.
Sponsored · Affiliate link
Save 20% on fees trading on WEEX
Base Camp may earn a commission if you sign up. It never affects what we write.
What Happened the Last Times Bitcoin Lost the 50-Week MA?
Mostly a fast return, but not always a happy one. On Binance’s BTC/USDT chart, which starts in August 2017, Bitcoin has lost the line after at least seven weekly closes above it five times before this week.
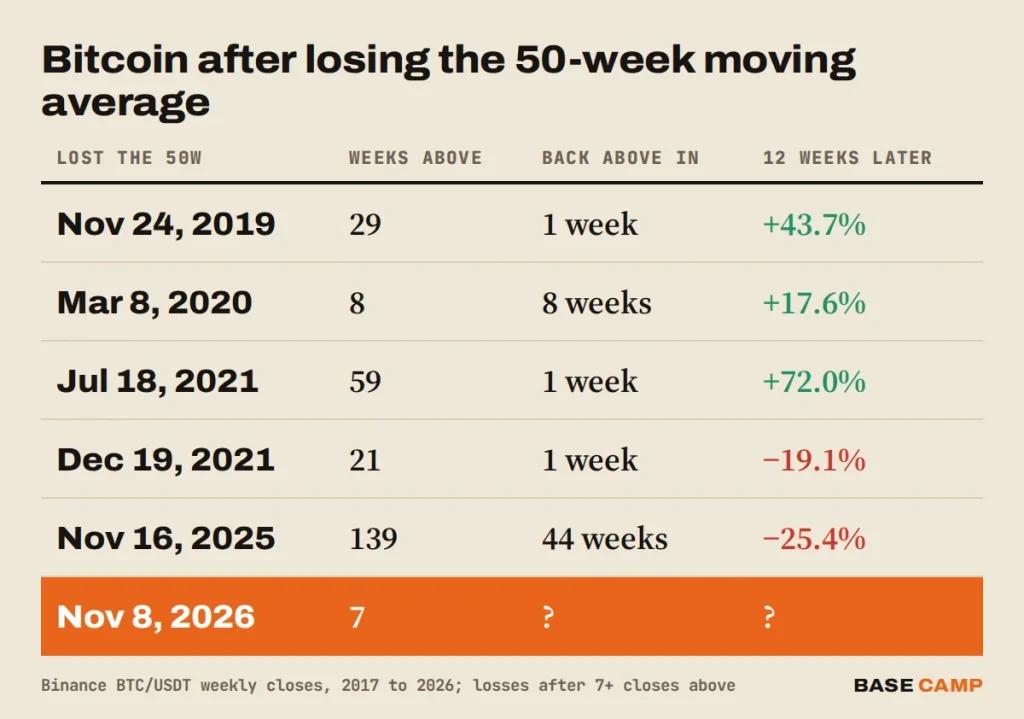
The 2019 case is the one Thorn leans on, and it looks the most like today. It came after a bear market low, like now, and after a long stay above the Bitcoin 50-week moving average. Bitcoin won the line back on May 5, 2019, less than five months after a $3,229 weekly close low, and held it for 29 weeks. Then it chopped. BTC closed under the average four times between November 2019 and early January 2020, and every time it was back above within two weeks.
March 2020 broke the one-month pattern. The Covid crash kept Bitcoin under the line for eight weeks and dragged the weekly close to $5,361. Even that sat 66% above the December 2018 low, and by the end of the year BTC had made a new all-time high.
December 2021 is the warning. Bitcoin dipped under, closed back above a week later and still rolled into a bear market that cut the weekly close to $16,280 by November 2022. Galaxy’s chart has an answer for it: those reclaims, in December 2021 and March 2022, came before the bear’s low, not after it. The difference only shows once the low is in.
November 2025 is the other kind entirely. After 139 weeks above, Bitcoin lost the line at $94,261 and didn’t close back over it for 44 weeks.
SIDE TRAIL: Bitcoin Weekly Close: Fourth Red Week in a Row at $78,354
BTC Price Analysis: Where Is the Bitcoin 50-Week Moving Average Now?
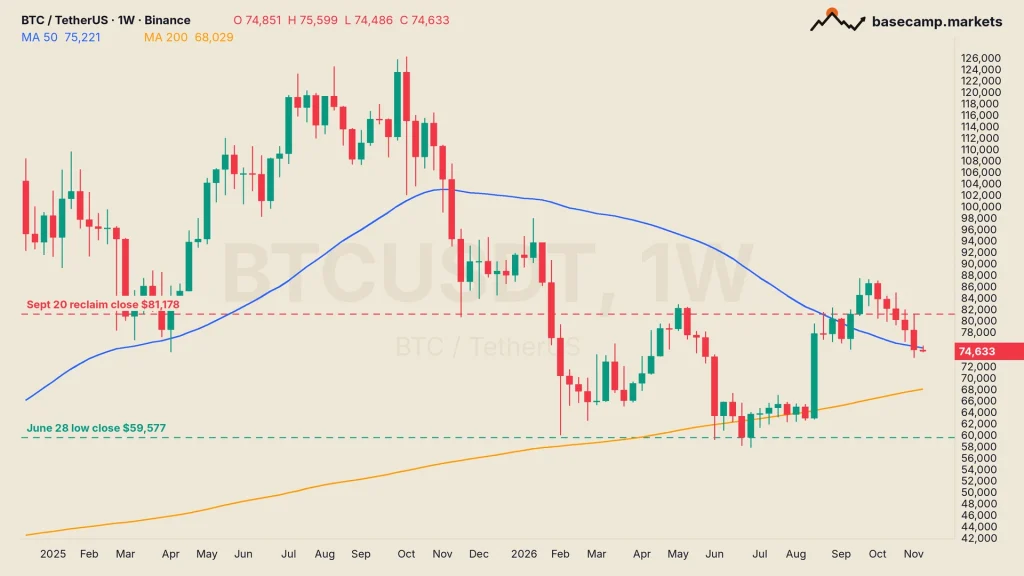
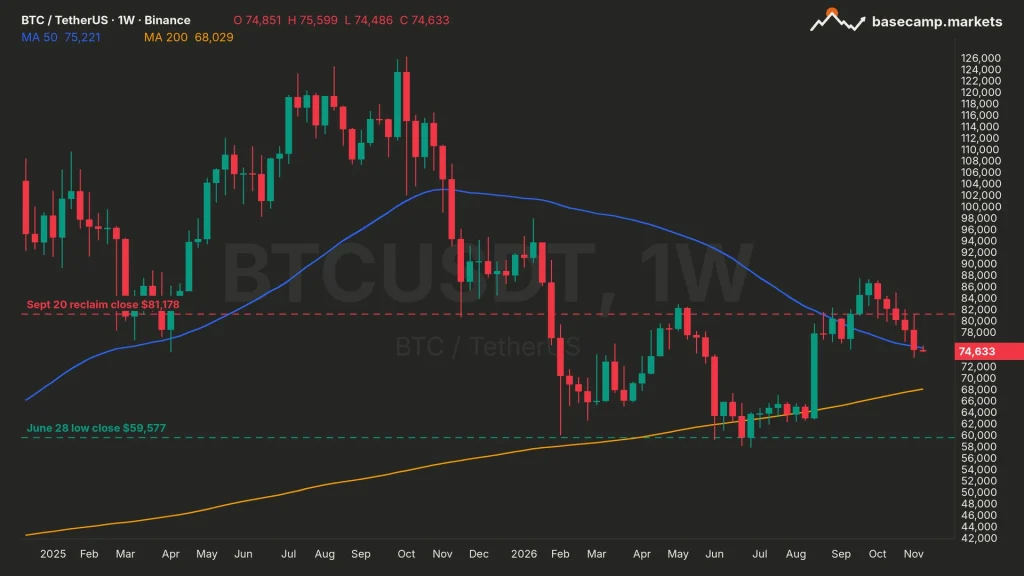
Just under $1,000 above the price, and coming down to meet it. The 50-week moving average is the mean of the last 50 weekly closes. Each new close pushes out one from a year ago, and the ones leaving over the next four weeks sit between $88,000 and $90,400, from late 2025, when BTC still traded near $90,000.
In other words, the bar for Thorn’s reclaim drops every Sunday. If Bitcoin went sideways at today’s price, the average would slide from $75,535 to about $74,400 by the December 6 close, roughly $300 a week. A flat month would almost get the job done by itself. Counted in weekly closes, Thorn’s “within a month” means one of four closes, on November 15, 22, 29 or December 6, finishing above the line.
Traders who use the exponential version see a worse picture. The 50-week EMA, which gives recent weeks more weight, stands at $78,432, and Bitcoin has closed under it two weeks running. Only the simple average was still being defended on Sunday.
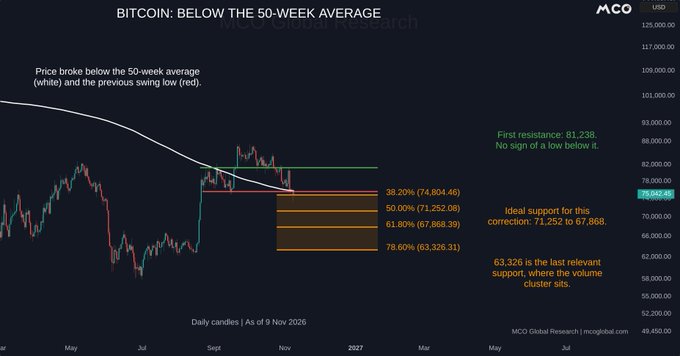
Not everyone is waiting for a reclaim. The chart analyst behind More Crypto Online sees no confirmed low while Bitcoin stays under $81,238, and has support lower down:

$BTC is now below its 50-week average and the previous swing low.
The ideal support for this correction sits at $71,252 to $67,868. $63,326 is the last relevant support, where the volume cluster sits.
Below $81,238, I see no confirmed low.
The levels on the weekly chart, with October’s CPI report due on Tuesday at 13:30 UTC (8:30 a.m. in Washington):
- $75,535: the 50-week moving average at Sunday’s close. A weekly close above it, even by a little, is the reclaim Thorn is looking for.
- $78,354 to $78,432: the open of last week and the 50-week EMA, almost on top of each other.
- $73,510: Sunday night’s low, set in the four-minute flash crash that hit Ethereum hardest.
- $68,000: roughly where the 200-week moving average sits.
- $59,577: the June 28 weekly close. Thorn’s “bottom in” depends on it.
TRAIL MAP: Indicators Worth Knowing: Moving Averages, RSI and Volume
Four Bitcoin weekly closes are left in Thorn’s window. At today’s price, the line gets about $300 easier to beat at each one.

VikingXBT has been trading crypto since 2017. The focus is futures, onchain data and automation. Onchain flows get checked before a chart is trusted, and anything repetitive gets automated. VikingXBT built Base Camp's own onchain scanner, which flags bundlers, snipers, dev holdings and wallet clusters in one view, and backtests strategies before trading them.
More from VikingXBT