
The short version
- Ethereum price prediction hinges on one zone now: ETH fell below $2,000 on Friday and touched $1,895.95, its lowest price since August 18.
- Trader Ted Pillows calls $1,850 to $1,950 the last major support; ETH based there for three weeks before a 33% run in late August.
- ETH has closed five red weeks in a row and is down about 28% since October 5, with Bitcoin under $70,000 and Ethereum ETFs still seeing outflows.
- Next: the weekly close at 00:00 UTC Monday (7:00 p.m. Sunday in New York), and whether $1,822.06 holds. Follow Base Camp on X for updates like this.
ETH fell below $2,000 on Friday and touched $1,895.95 on Binance, its lowest price since August 18, which turns every Ethereum price prediction this week into one question: does the August base hold? The ETH price trades at $1,956.96 at the time of writing (13:30 UTC), down 2.58% over 24 hours and 12.50% over the week.
That puts ETH right inside the band traders now treat as the line in the sand. Ted Pillows, a crypto trader on X, called $1,850 to $1,950 Ethereum’s “last major support zone” on Friday morning and warned that losing it “could drop Ethereum to cycle lows.” So what makes this zone special, and what happens if it gives way?
His chart marks the zone right where the August pump started:

$ETH is back to the same level where the August pump started.
Now, ETH is at its last major support zone around $1,850-$1,950, and losing this could drop Ethereum to cycle lows.
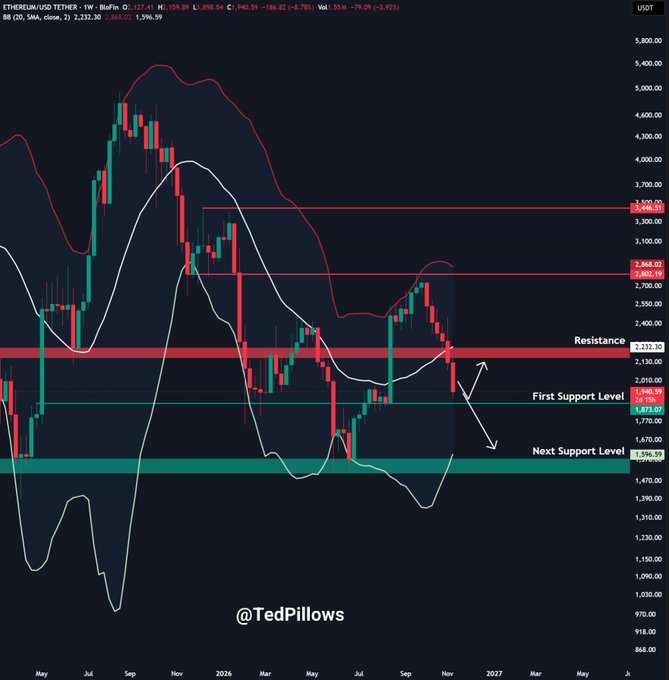
The August Base Is Back in Play
ETH spent more than three weeks in this exact range over the summer. From July 26 to August 18 it chopped between $1,822.06 and $1,981.24 on Binance, and every daily close in that stretch landed between $1,844.94 and $1,954.72. Then it left in a hurry. A 17% candle on August 19 broke the range, and by August 21 ETH was trading at $2,546.78, a 33% run in three days.
That history is why the zone matters. A range where price sat for weeks is a range where a lot of people bought. Many of those buyers are now back at break-even, and they tend to do one of two things: defend their entry, or sell to get out flat. In other words, this is where we find out which crowd is bigger.
Ted’s zone lines up with that base almost exactly, which is why it reads as real Ethereum support and not a line drawn for the occasion. Its floor, $1,850, sits just under the August 11 low of $1,853.62, and its ceiling, $1,950, is about where the base’s highest closes were. Friday’s low landed in the middle.
Sponsored · Affiliate link
Save 20% on fees trading on WEEX
Base Camp may earn a commission if you sign up. It never affects what we write.
How Did ETH Lose $2,000?
Slowly, then all at once. ETH closed at $2,424.61 on November 3 after a one-day pop to $2,450, and gave the whole move back the next day. The daily closes since then tell the story: $2,127.46 on November 7, $2,053.21 on November 9, $2,056.36 on November 11 and $2,019.74 on Thursday. Each bounce got smaller, and on Friday the round number finally broke. ETH below $2,000 also means ETH below the 0.618 Fibonacci retracement of its June-to-September rally, a level many traders treat as the last stand of an uptrend.
Zoom out to the weekly chart and it looks worse. ETH has closed five weeks in a row in the red, and this one is down about 8.0% so far.
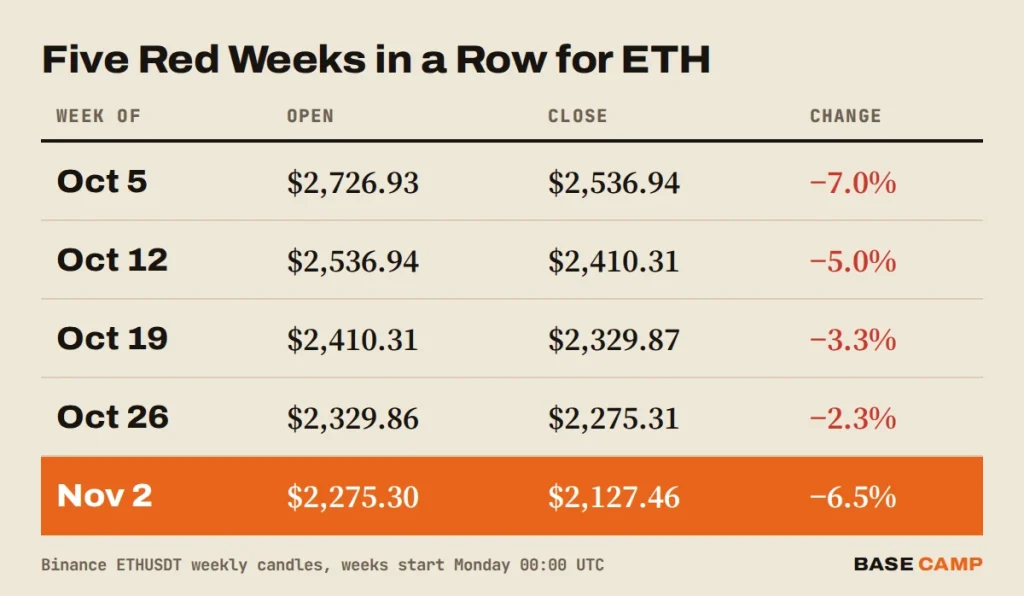
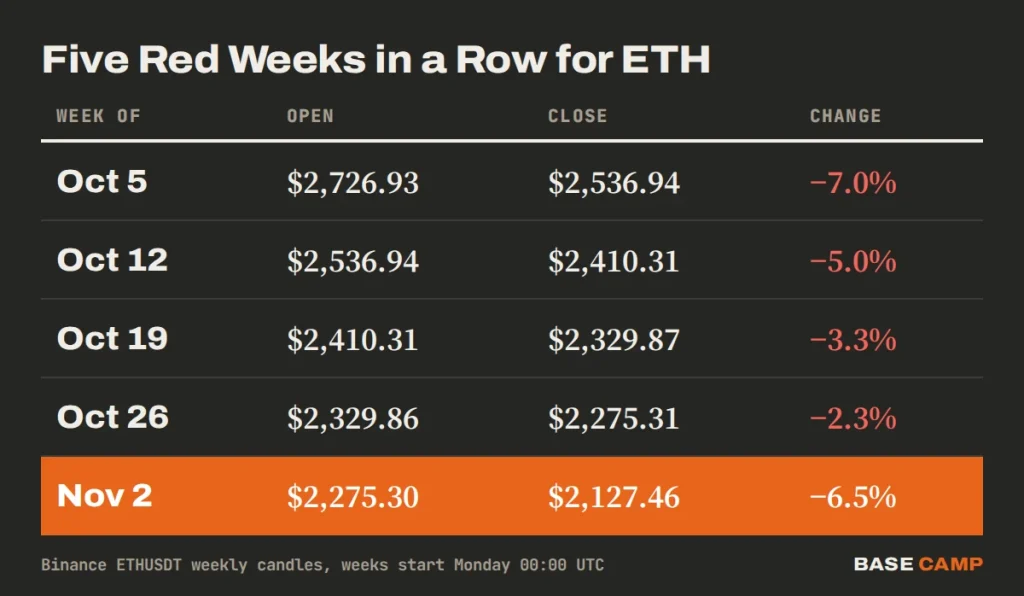
For context, ETH opened the week of October 5 at $2,726.93. It is down about 28% since then, and there was no single crash in that stretch, just one lower close after another.
The rest of the market didn’t help. Bitcoin fell below $70,000 early on Friday for the first time since August and trades at $69,181, down 4.69% over 24 hours. The spot Ethereum ETFs have been leaking money all month, too, with $144.8 million out on Wednesday alone, most of it from BlackRock’s ETHA. The Crypto Fear & Greed Index sits at 20, extreme fear, down from 28 a day earlier.
SIDE TRAIL: Ethereum ETF Outflows Hit $144.8M as ETHA Loses $129.8M, Bitcoin ETFs Red for a Fifth Day
Ethereum Price Prediction: Can ETH Hold $1,850?
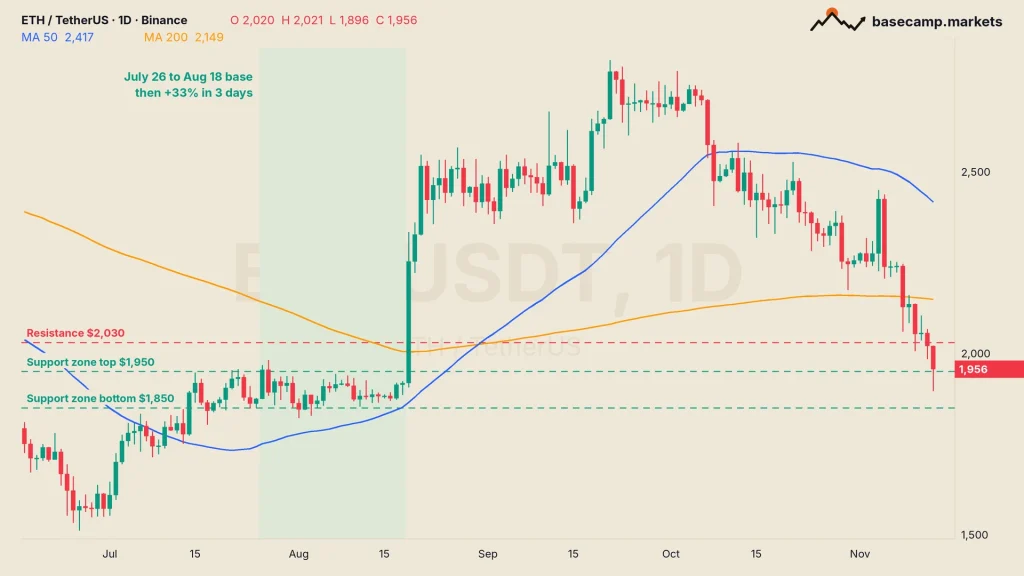
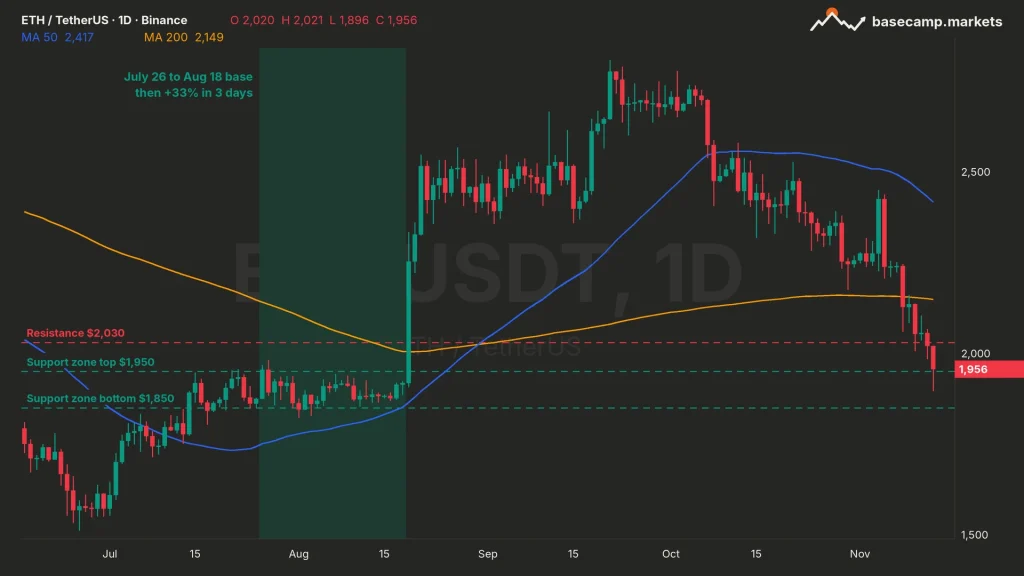
Yes, it can, but the bounce has to start here. ETH is already about 3% off Friday’s low, which is the kind of reaction a real support zone should give, but one bounce isn’t a hold.
The trend still points down. Both moving averages (MA), the average daily close over the last 50 and 200 days, sit above the price: the 50-day MA at $2,416.71 and the 200-day at $2,148.94. ETH closed under the 200-day on November 7 and hasn’t been back since.
These are the levels that decide the next move:
- The first ceiling: $2,000 to $2,030. The round number ETH just lost, with the 0.618 Fibonacci retracement of the June-to-September rally at $2,002.91 sitting right on it. Friday’s high stopped at $2,021.11.
- The bigger ceiling: $2,148.94, the 200-day MA. A close back above it would make this week look like a shakeout instead of a breakdown.
- The zone: $1,950 down to $1,850. Friday’s low sits in the middle, and the August 11 low is near the bottom edge.
- The floor under the floor: $1,822.06, the August 1 low and the lowest point of the whole summer base.
- Below that: the next big low on the chart is $1,505.68 from June 6, about 23% under the current price. That is the low a clean break of the zone would put back on the table.
A brief wick under $1,850 wouldn’t settle much. Levels this widely watched often get swept for stops before they hold, so the daily close is what counts, and a close under $1,822.06 would mean the August base has failed.
The bulls have a clear first job. ETH’s weekly candle closes at 00:00 UTC on Monday, November 16 (7:00 p.m. Sunday in New York), and only a close above $2,127.46 would end the red streak at five.
TRAIL MAP: Support and Resistance for Crypto Beginners

VikingXBT has been trading crypto since 2017. The focus is futures, onchain data and automation. Onchain flows get checked before a chart is trusted, and anything repetitive gets automated. VikingXBT built Base Camp's own onchain scanner, which flags bundlers, snipers, dev holdings and wallet clusters in one view, and backtests strategies before trading them.
More from VikingXBT