
The short version
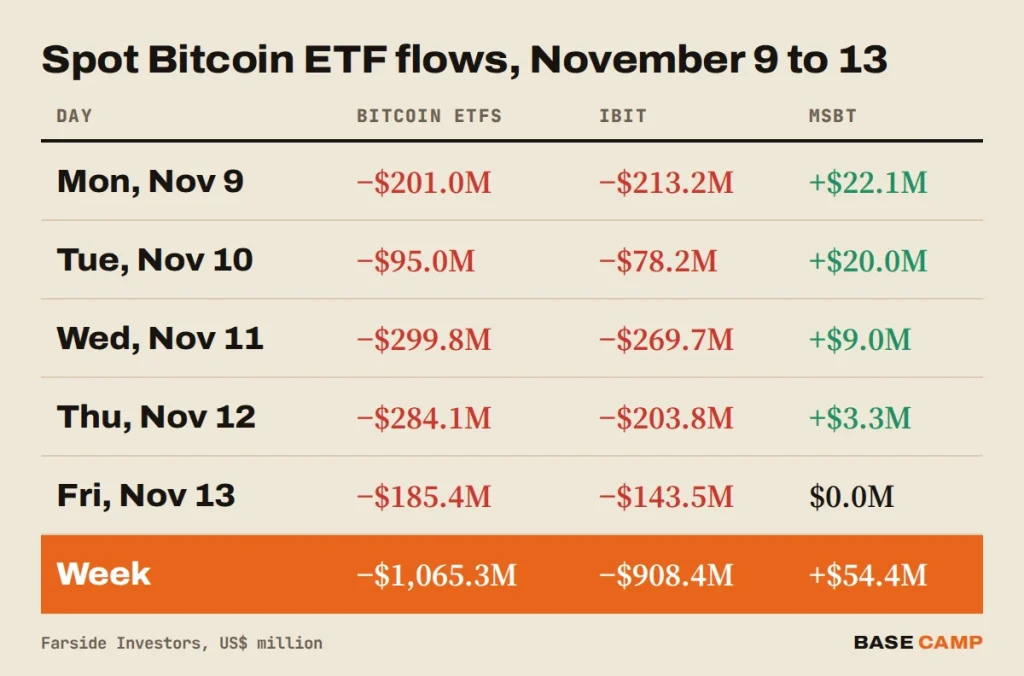
- Bitcoin ETF outflows came to $1,065.3 million from November 9 to 13, the second $1 billion-plus week in a row, with all five days red.
- BlackRock’s IBIT lost $908.4 million of it and has been red for 11 sessions, about $2.35 billion, while Morgan Stanley’s MSBT was the only fund buying.
- Ethereum ETFs lost $398.9 million, a seventh losing week in a row, and BTC closed Friday at $68,314, its lowest daily close since August 18.
- Next: Monday’s flows after the US close at 21:00 UTC, with BTC sitting just above support at $66,456.
Two weeks ago, a billion-dollar week of selling would have looked like a one-off. Now it looks like a habit. US spot Bitcoin ETFs lost $1,065.3 million from November 9 to 13, and the Bitcoin ETF outflows came on all five days.
That follows $1,281.7 million out the week before, so November has lost $2.35 billion in ten sessions. BlackRock’s IBIT was $908.4 million of this week’s total. The group hasn’t had a green day since November 4, seven sessions ago, and BTC closed Friday at $68,314, down 9.9% on the week.
So is the selling slowing down, or just catching its breath? Farside’s Friday post has the last day for every fund:

𝗕𝗶𝘁𝗰𝗼𝗶𝗻 𝗘𝗧𝗙 𝗙𝗹𝗼𝘄 (𝗨𝗦$ 𝗺𝗶𝗹𝗹𝗶𝗼𝗻) – 2026-11-13
TOTAL NET FLOW: -185.4
IBIT: -143.5
FBTC: -41.9
BITB: 0
ARKB: 0
BTCO: 0
EZBC: 0
BRRR: 0
HODL: 0
BTCW: 0
MSBT: 0
GBTC: 0
BTC: 0
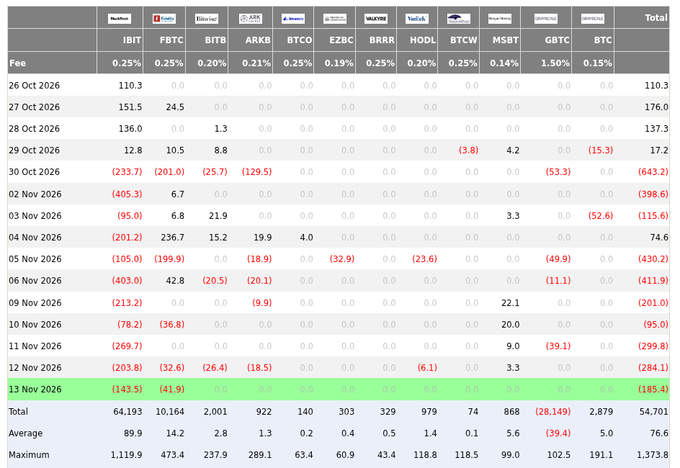
How Bad Were Bitcoin ETF Outflows This Week?
Slightly less bad than last week, but red every day instead of four days out of five. The $1,065.3 million out works out to about $213 million a day, against $256 million a day from November 2 to 6, per Farside’s data.
Wednesday was the worst day at $299.8 million, Thursday close behind at $284.1 million. Friday’s $185.4 million came from only two funds: IBIT lost $143.5 million and Fidelity’s FBTC $41.9 million, while the other ten reported zero.
For context, October lost $515.9 million in the whole month. November is at four and a half times that with ten trading days still to go.
Sponsored · Affiliate link
Save 20% on fees trading on WEEX
Base Camp may earn a commission if you sign up. It never affects what we write.
Is the Selling Slowing Down?
Not in any way that shows up yet. The weekly total shrank by about 17%, but the streak got longer, and that matters more for the mood. Seven straight red sessions means nobody, not even the dip buyers who showed up on November 4, has stepped in for a full day.
It helps to follow the chain here. BTC broke under its 200-day moving average on Thursday, the line a lot of funds and traders treat as the border between a pullback and a downtrend. Funds that trade on trend signals tend to cut exposure when that line goes. Their selling shows up as ETF outflows, the issuers sell Bitcoin to pay them out, and the price drops a bit further. That is roughly what Thursday and Friday looked like: $469.5 million out over two days while BTC fell from $74,015 to $68,314.
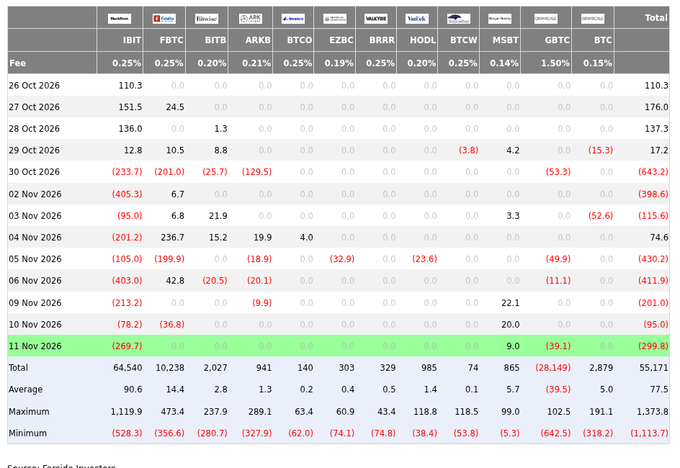
The week’s biggest single exit came a day earlier, on Wednesday, and it was almost all BlackRock:

𝗕𝗶𝘁𝗰𝗼𝗶𝗻 𝗘𝗧𝗙 𝗙𝗹𝗼𝘄 (𝗨𝗦$ 𝗺𝗶𝗹𝗹𝗶𝗼𝗻) – 2026-11-11
TOTAL NET FLOW: -299.8
IBIT: -269.7
FBTC: 0
BITB: 0
ARKB: 0
BTCO: 0
EZBC: 0
BRRR: 0
HODL: 0
BTCW: 0
MSBT: 9
GBTC: -39.1
BTC: 0
That chain also explains why a smaller week of Bitcoin ETF outflows can still feel worse. The money leaving is not bigger, it is just steadier.
SIDE TRAIL: Bitcoin ETF Outflows Hit $1.28B This Week as IBIT Loses $1.21B
IBIT Outflows: 11 Sessions and $2.35 Billion
IBIT outflows came on every day again, and BlackRock’s run now stretches back to October 30: eleven sessions, about $2.35 billion out. IBIT took 85% of this week’s outflow, down from 94% the week before, which tells you the selling spread a little.
The rest of the board over the five days:
- FBTC: −$111.3 million, on Tuesday, Thursday and Friday.
- Grayscale’s GBTC −$39.1 million, all on Wednesday; ARK’s ARKB −$28.4 million; Bitwise’s BITB −$26.4 million; VanEck’s HODL −$6.1 million.
- Morgan Stanley’s MSBT: +$54.4 million, the only fund that took in money all week.
Thursday was the broadest day, with five funds in the red at once. That is the one to keep an eye on: a single big holder leaving IBIT is one thing, but five issuers seeing redemptions on the same day looks more like the wider market stepping back.
MSBT is the small bright spot. It added money on four of the five days, and at 0.14% a year it is the cheapest fund in Farside’s table, against 0.25% for IBIT. It is still tiny, with $868 million of net inflows since launch to IBIT’s $64.19 billion.
Across all twelve funds, net inflows since launch are down to $54.70 billion.
Ethereum ETF Outflows: Seven Weeks in a Row
Ethereum ETF outflows reached $398.9 million this week, per Farside, a seventh losing week in a row and a bit worse than the $365.2 million the week before. November is now $764.1 million in the red.
BlackRock’s ETHA did most of the damage again, with $119.3 million out on Monday, $129.8 million on Wednesday and $62.0 million on Thursday. Friday finally broke the run with a $2.3 million inflow, the first green day since November 4, as Fidelity’s FETH took in $11.6 million and Grayscale’s mini fund lost $9.3 million:

𝗘𝘁𝗵𝗲𝗿𝗲𝘂𝗺 𝗘𝗧𝗙 𝗙𝗹𝗼𝘄 (𝗨𝗦$ 𝗺𝗶𝗹𝗹𝗶𝗼𝗻) – 2026-11-13
TOTAL NET FLOW: 2.3
ETHA: 0
ETHB: 0
FETH: 11.6
ETHW: 0
TETH: 0
ETHV: 0
QETH: 0
EZET: 0
MSSE: 0
ETHE: 0
ETH: -9.3
A $2.3 million green day is not a turnaround. Still, one group of funds stopped selling for a day, and the Bitcoin funds can’t say the same. The ETH price is $1,900 at the time of writing, after a dip to $1,878 on Saturday, its lowest since August 17, and below its 200-day average at $2,147.
Bitcoin Price Analysis: Where Is the Floor Now?
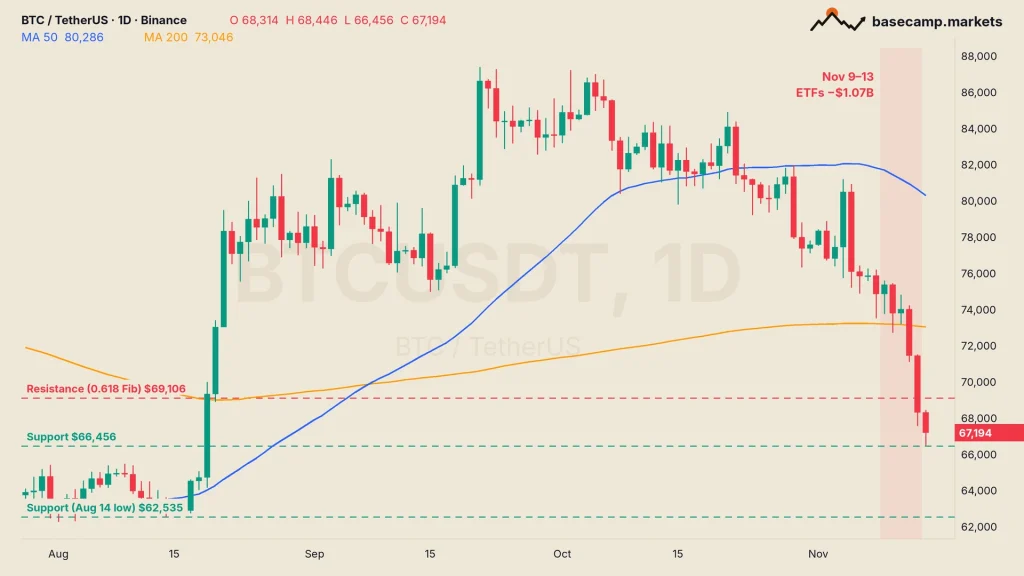
The first floor is Saturday’s low at $66,456, with the August 14 low at $62,535 below it. The BTC price is $66,977 at the time of writing, its lowest since August 19, and the Fear & Greed index reads 13, extreme fear.
Friday’s close at $68,314 was the lowest daily close since August 18, and it sits about 6.5% under the 200-day moving average at $73,046. Here is the map:
- Resistance: $69,106, the 0.618 Fibonacci level of the July to September rally, then the 200-day MA at $73,046.
- The area to watch: $66,456. If BTC closes a day under it, the next real support on the chart is the August 14 low at $62,535.
A daily close back above $69,106 with a green flow day behind it would be the first sign the selling has run its course. One without the other would mean less.
TRAIL MAP: Indicators Worth Knowing: Moving Averages, RSI and Volume
Monday’s numbers land after the US close at 21:00 UTC (4:00 p.m. in New York), and they decide whether the red run reaches eight.

Teddy has been trading crypto since 2016. The focus is altcoins and EMA setups: finding coins sitting on key levels, waiting for support to hold or a range to be reclaimed, and trading the move from there. Bitcoin sets the tone, but the opportunities are usually in the alts.
More from Teddy