
The short version
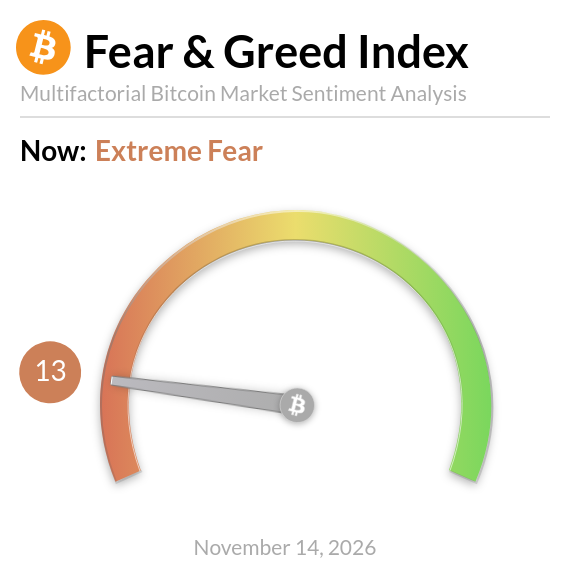
- Crypto Fear and Greed Index readings fell from 28 on Thursday to 13 on Saturday, the lowest since July 1, as Bitcoin dropped to $66,397 on Bitstamp.
- Last time it was this low, fear came early: the index hit 8 on June 8 with BTC at $63,062, and the lowest close, $58,526, came 22 days later.
- Extreme fear lasted 35 days in a row from June 2 to July 6, and the breakout to $78,325 only came in late August.
- Next: whether Bitcoin holds a daily close above $66,500, the level that capped the June and July range.
Crypto traders haven’t been this scared since the summer, and the last time they were, Bitcoin was printing its low for the year. The Crypto Fear and Greed Index reads 13 on Saturday, down from 28 on Thursday and 20 on Friday, its lowest since July 1.
Bitcoin trades at $67,313 at the time of writing, down 2.2% in 24 hours and 11.4% in a week, after touching $66,397 on Bitstamp, its lowest price since August 19. November is now about 13% below October’s close of $77,430. The altcoins look worse: Ethereum is at $1,903.21, Solana at $75.59 and XRP at $0.9937.
So does a reading this low mean the bottom is in? The June stretch gives a real answer, and it is a calmer one than most people expect.
The index’s own daily account posted the 13 overnight, with Bitcoin still above $68,000 at the time:

Bitcoin Fear and Greed Index is 13 ~ Extreme Fear
$BTC Current price: $68,272
What the Crypto Fear and Greed Index Actually Measures
It is a daily mood score for Bitcoin, from 0 (extreme fear) to 100 (extreme greed), built by alternative.me. It reads mostly price action, plus a bit of crowd behavior:
- Volatility (25%): today’s swings and drawdowns against the 30-day and 90-day averages.
- Momentum and volume (25%): how hard and how heavily the market is moving.
- Social media (15%): posts and engagement on X about Bitcoin.
- Dominance (10%) and Google Trends searches (10%).
A fifth input, surveys, is listed at 15% but marked as paused on the site. So when price drops fast on heavy volume, as it did this week, the index falls with it almost by design. That is worth keeping in mind: a reading of 13 mostly tells you the last few days were ugly, which you already knew. The useful part is the history, because it shows how long that feeling tends to stick around. Our glossary has the short version.
Sponsored · Affiliate link
Save 20% on fees trading on WEEX
Base Camp may earn a commission if you sign up. It never affects what we write.
What Did Bitcoin Do After the June Extreme Fear Run?
It kept falling for three weeks, then crawled sideways, and only broke out in mid-August. Extreme fear (a reading of 25 or lower on alternative.me’s scale) started on June 2 and lasted every single day until July 6, 35 days in a row. The low point was 8 on June 8.
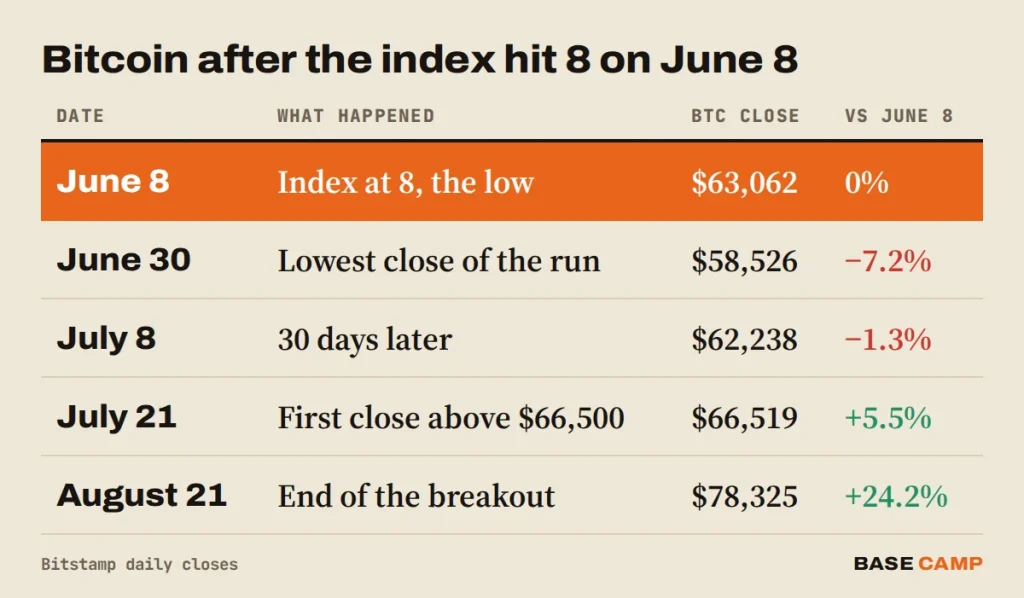
Here is how it played out, step by step. Fear peaked on June 8 with Bitcoin at $63,062. That was not the low: price kept bleeding and closed at $58,526 on June 30, another 7.2% down. The next day, July 1, it wicked to $57,735 on Bitstamp, still the lowest price of 2026, and the index printed 11 that same day.
So the lowest reading came three weeks before the lowest close, and a second scary print landed on the day of the low itself. Anyone who bought the first scary reading had to sit through a further drop first. Thirty days after the low reading, Bitcoin was still 1.3% under where it started.
The recovery was slow, too. Bitcoin did not close above $66,500 again until July 21, and spent most of the next four weeks between roughly $62,000 and $66,000. The real move came from August 19 to 21, when it ran from $64,686 to $78,325 in three daily closes. The index read 41 the day before that run started, back in plain fear, no longer extreme.
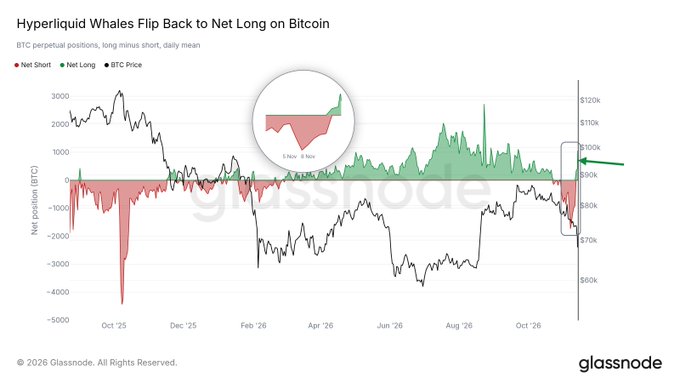
Some big traders have already picked a side. Glassnode noted on Friday that the Hyperliquid whale cohort it tracks, the same group that stayed long through the whole August pump, had just flipped back to net long:

Hyperliquid whales just flipped back to net long on $BTC.
Over the last two weeks they were short; their first short exposure since early 2026.
They were short from the top and long through the whole August pump.
Will they be right again this time?
SIDE TRAIL: Is Bitcoin in a Bear Market? CryptoQuant Draws the Line at $73,000 as Its Bull Score Hits 0
March Went the Other Way
Not every Bitcoin extreme fear run looks like June, and the crypto fear and greed index history from earlier this year shows two other endings. Bitcoin bottomed at $64,955 on Bitstamp on March 29 with the index at 9, and the index read 8 the next day as it closed at $66,731. Six weeks later, on May 10, Bitcoin closed at $82,193, up 23.2%, and the index was back at 47. February was a third version: the index hit 5 on February 12 and again on February 23, while Bitcoin moved sideways between about $62,000 and $71,000 on daily closes.
Three runs, three different paths. The chain is simple enough:
- Price falls fast, so volatility and momentum readings drop.
- Those two inputs make up half the index, so the score crashes with price.
- The score then stays low for as long as price stays weak, which can be days or five weeks.
In other words, extreme fear shows that sellers are tired and nervous. It does not say when they are done. The pattern that held across all three runs was smaller: the lowest prices came while the index sat at 15 or below, but no reading said which low one would be the last. Our trading psychology guide covers why that is so hard to act on in real time.
What does that mean for anyone looking at the Crypto Fear and Greed Index today? Mostly patience. A low reading has been a decent sign that a bottom is somewhere near in price, within 10% in all three runs this year, but a poor guide to the day. In June, “somewhere near” still meant another 7.2% lower first.
Bitcoin Price Analysis: Is $66,500 the Line Again?
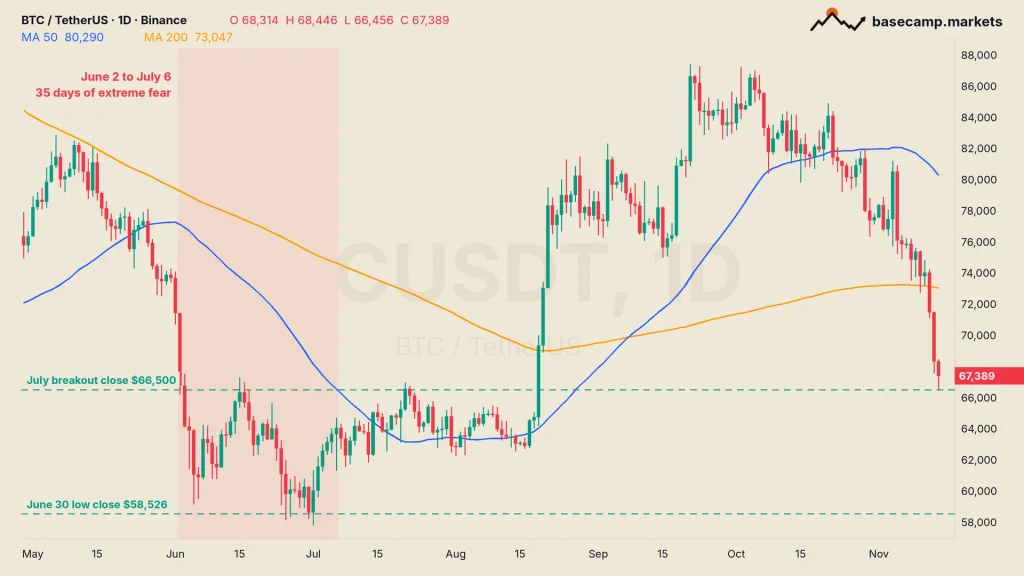
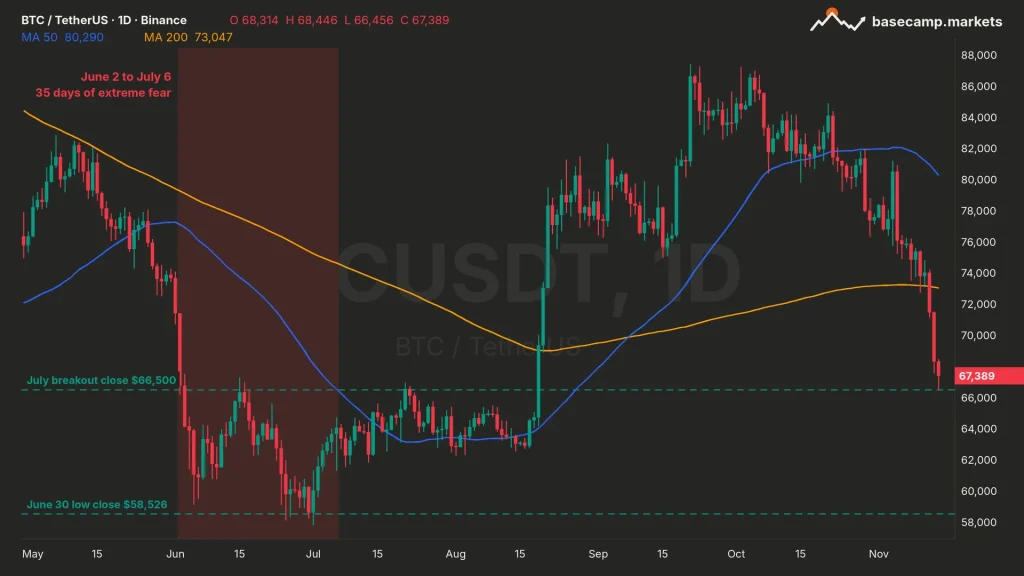
For now, yes. The same $66,500 area that capped the summer range is back under the price, and Saturday’s dip to $66,397 on Bitstamp poked just under it. A daily close below it puts Bitcoin back inside the June to August range.
Above, the first ceiling is the 200-day moving average at $73,047, the average close of the last 200 days, which Bitcoin lost this week. The 50-day sits far higher, at $80,290, and is turning down. Below $66,500, the swing low at $62,535 is the next floor, and the 2026 lows at $58,115 to $57,800 on Binance sit under that.
TRAIL MAP: DCA: The Simplest Crypto Strategy (and Why It’s So Hard to Beat)
If June is the template, the reading of 13 is a sign of where the market sits today, not of where it turns. June’s lowest close came 22 days after its lowest index reading.

Teddy has been trading crypto since 2016. The focus is altcoins and EMA setups: finding coins sitting on key levels, waiting for support to hold or a range to be reclaimed, and trading the move from there. Bitcoin sets the tone, but the opportunities are usually in the alts.
More from Teddy