
The short version
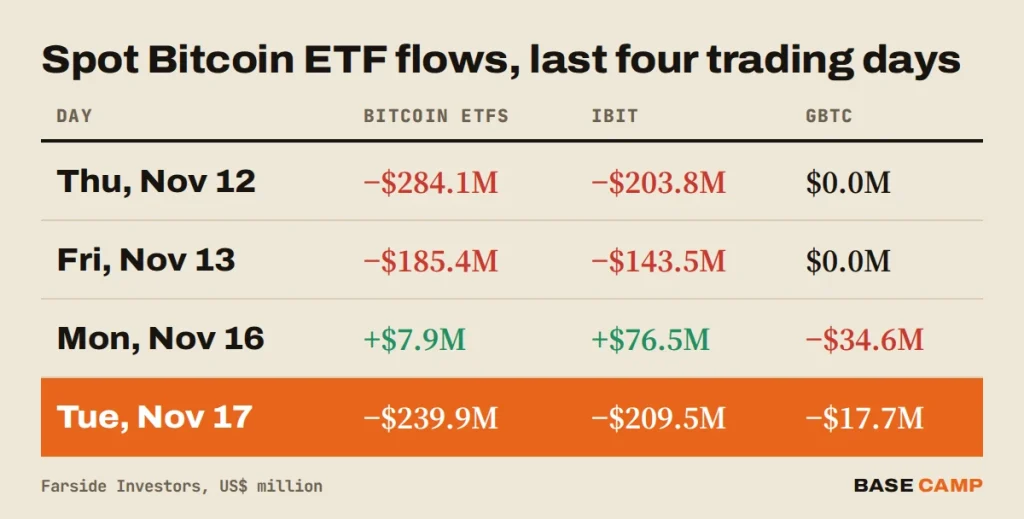
- Bitcoin ETF outflows came back at $239.9 million on November 17, the biggest daily exit since November 12, one session after a $7.9 million green day.
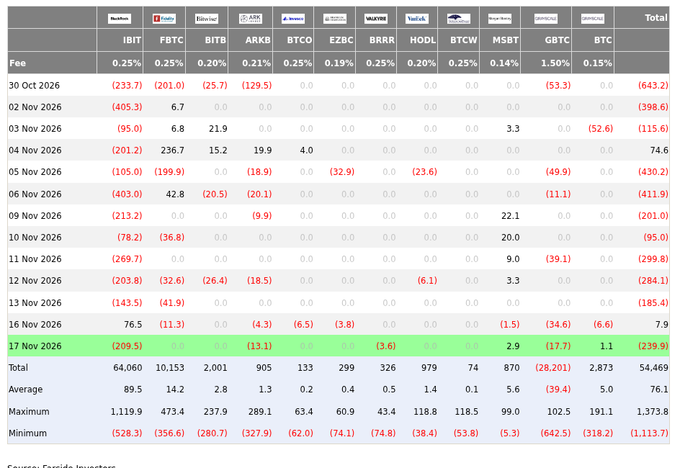
- BlackRock’s IBIT lost $209.5 million, almost three times the $76.5 million it took in on Monday, and made up about 87% of the day’s outflow.
- Next: whether IBIT turns red again in Wednesday’s flows, which Farside posts after the US close.
$209.5 million. That is what left BlackRock’s IBIT on Tuesday, November 17, one session after the fund took in $76.5 million and broke a two-week run of selling. Bitcoin ETF outflows came back with it: the twelve US spot funds lost $239.9 million between them.
What changed in one day:
- IBIT gave back almost three times Monday’s inflow, its biggest exit since November 11.
- The group total was the worst day since November 12, when $284.1 million left.
- Only two funds took in money, and together they added $4.0 million.
So was Monday a turn, or a pause?
Farside’s Tuesday post has every fund:

𝗕𝗶𝘁𝗰𝗼𝗶𝗻 𝗘𝗧𝗙 𝗙𝗹𝗼𝘄 (𝗨𝗦$ 𝗺𝗶𝗹𝗹𝗶𝗼𝗻) – 2026-11-17
TOTAL NET FLOW: -239.9
IBIT: -209.5
FBTC: 0
BITB: 0
ARKB: -13.1
BTCO: 0
EZBC: 0
BRRR: -3.6
HODL: 0
BTCW: 0
MSBT: 2.9
GBTC: -17.7
BTC: 1.1
IBIT Did Most of the Selling Again
IBIT alone made up about 87% of Tuesday’s outflow, per Farside’s IBIT post. Grayscale’s GBTC lost $17.7 million, ARK’s ARKB $13.1 million and BRRR $3.6 million. Morgan Stanley’s MSBT took in $2.9 million and Grayscale’s mini Bitcoin fund $1.1 million. The other six funds, Fidelity’s FBTC among them, reported zero.
Over Monday and Tuesday together, IBIT is $133.0 million in the red. Since October 30 it has lost about $2.48 billion on every session but one.
Sponsored · Affiliate link
Save 20% on fees trading on WEEX
Base Camp may earn a commission if you sign up. It never affects what we write.
Why Do Bitcoin ETF Outflows From IBIT Matter Most?
Because IBIT is the biggest fund and the one large holders use, its flows set the tone for the group. When IBIT turned green on Monday, the total turned green with it, even though all eleven of the other funds were red or flat.
Tuesday flipped that. Monday read like the first crack in the selling; Tuesday says it was one buyer on one day. November’s Bitcoin ETF outflows now add up to $2.58 billion after twelve sessions, about five times the $515.9 million that left in all of October.
What would change the picture is two green days in a row with more than one fund buying. A second red IBIT day this week would put the fund back on the run it was on before Monday.
SIDE TRAIL: Bitcoin ETF Flows Turn Green by $7.9M: IBIT Takes $76.5M and Ends 7 Red Days
Ethereum ETFs Lose $29.1M
The Ethereum funds were red too. They lost $29.1 million on Tuesday, per Farside’s Ethereum post: BlackRock’s ETHA $27.6 million and ETHB $2.8 million, with $1.3 million into Bitwise’s ETHW and every other fund flat.
That takes November to about $801.6 million out. ETH trades at $1,804.60 at the time of writing, down 1.4% on the day, after a low of $1,753.07.
Bitcoin Price Analysis: Stuck Between $62,006 and $66,956
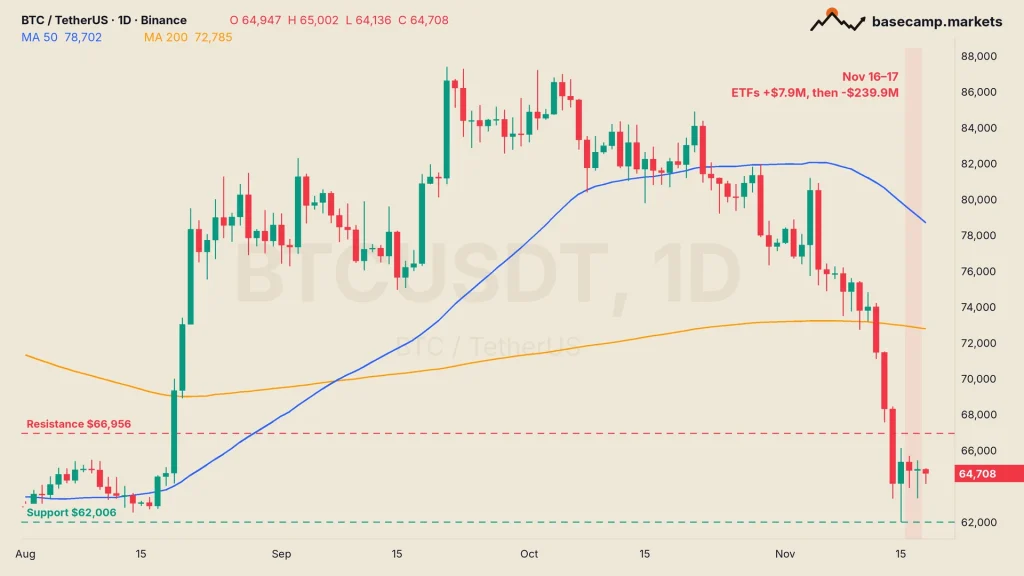
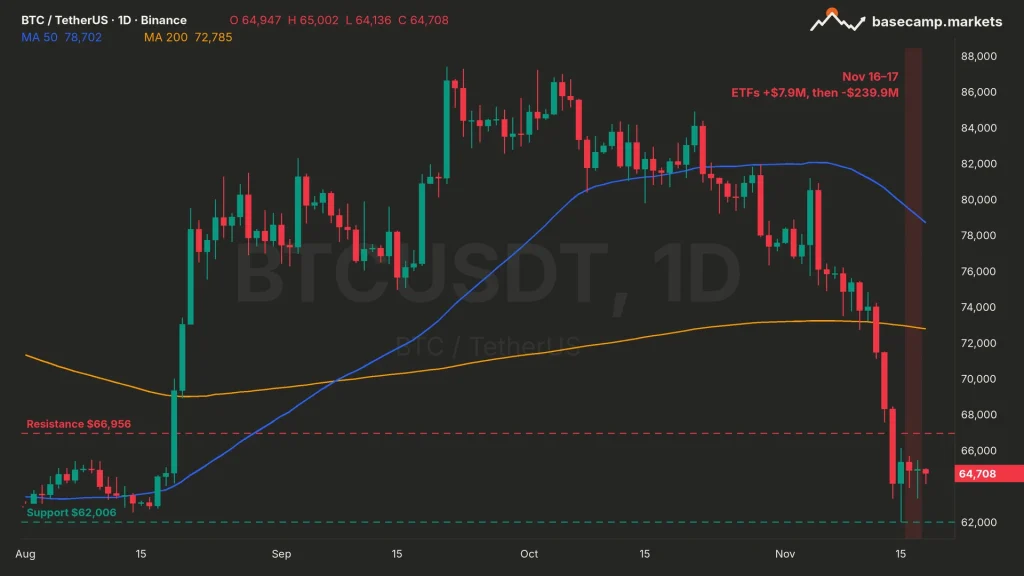
The BTC price is $64,511 at the time of writing, down 0.4% on the day and 12.4% on the week. Tuesday traded between $63,336 and $65,447 on Binance, inside the same box as Monday. The outflow didn’t break anything; it just kept the lid on.
The 200-day moving average, the average close of the last 200 days that traders use to separate a pullback from a downtrend, sits at $72,785, about 13% above the price. The levels:
- Resistance: $66,956, then the 200-day MA at $72,785.
- Support: Sunday’s low at $62,006, then $59,131.
TRAIL MAP: Crypto Fear and Greed Index Hits 13, Lowest Since July
Sentiment hasn’t moved either: Fear & Greed sits at 11, deep in extreme fear and a point under the day before. Wednesday’s flows come out after the US close on November 18.

TANG has been trading crypto since 2017. The focus is technicals, DeFi and onchain data. On the chart, that means high-timeframe support, moving averages and momentum divergences. Onchain, it means regular checkups on where the data puts the cycle. TANG once ran CryptoJungle, a free community for researching and trading together, and brings that same spirit to Base Camp as one of its co-founders.
More from TANG