The short version
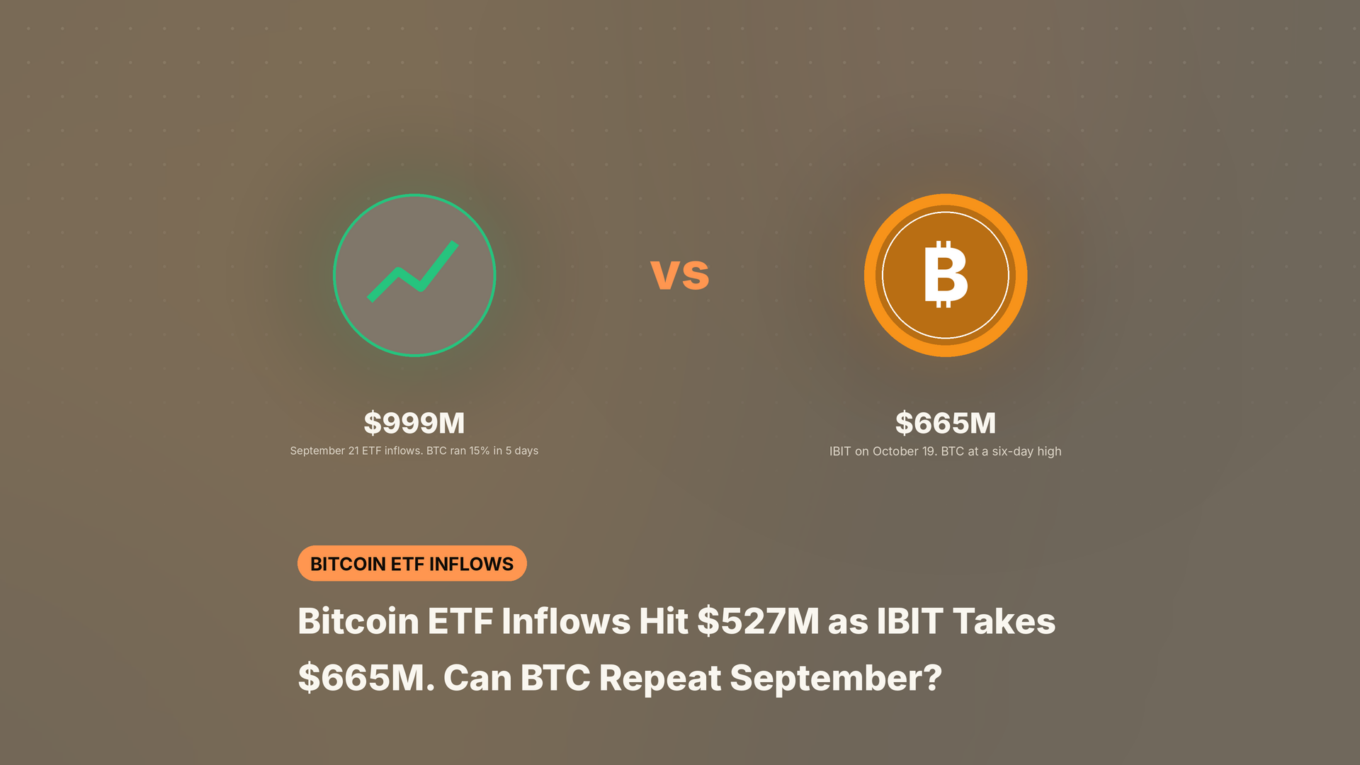
- Bitcoin ETF inflows hit a net $526.7 million on October 19, and BlackRock’s IBIT alone took $665.2 million.
- The last time flows were this big, in late September, Bitcoin ran about 15% in five days before stalling near $87,000.
- This time it was one fund on one day, so the crew is watching for more inflow days and the $87,220 ceiling.
Bitcoin ETF inflows just had their best day in almost a month, and BTC noticed. US spot Bitcoin ETFs took in a net $526.7 million on Monday, October 19, and BlackRock’s IBIT did more than all of it on its own with $665.2 million. On Tuesday, Bitcoin pushed to $83,440, its highest price in six days.
BTC trades at $83,360 at the time of writing, up 2.26% over 24 hours. The last time flows looked like this was late September, when Bitcoin ran about 15% in five days. So does Monday’s money start the same move, or was it a one-day spike?
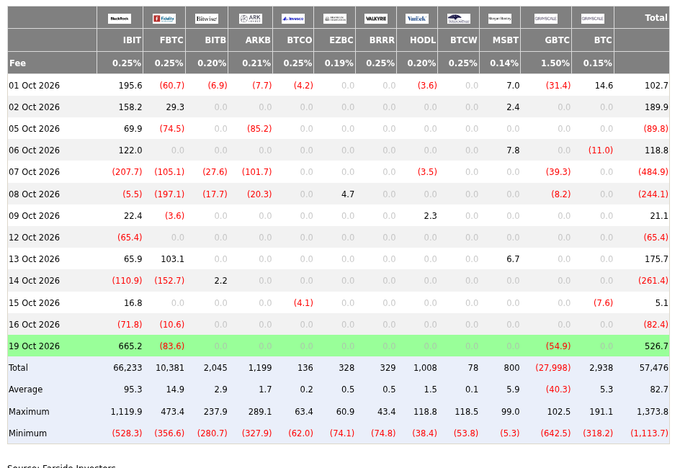
Farside Investors posted the fund-by-fund numbers:

𝗕𝗶𝘁𝗰𝗼𝗶𝗻 𝗘𝗧𝗙 𝗙𝗹𝗼𝘄 (𝗨𝗦$ 𝗺𝗶𝗹𝗹𝗶𝗼𝗻) – 2026-10-19
TOTAL NET FLOW: 526.7
IBIT: 665.2
FBTC: -83.6
BITB: 0
ARKB: 0
BTCO: 0
EZBC: 0
BRRR: 0
HODL: 0
BTCW: 0
MSBT: 0
GBTC: -54.9
BTC: 0
Where Did Monday’s $527 Million Go?
Almost all of it went into IBIT. BlackRock’s fund took $665.2 million, while Fidelity’s FBTC lost $83.6 million and Grayscale’s GBTC lost $54.9 million, according to Farside. The other nine funds saw no flows at all.
For context, the funds had bled for two straight weeks before this, with about $681 million out and then another $229 million. Even after Monday, October is still $88 million in the red. Big day, yes. A trend needs more of them.
The second push came from geopolitics. Pakistan’s army chief reportedly put a plan to end the war in front of both sides, and The New Arab reported on Monday that a breakthrough in US-Iran talks was expected this week. Oil slipped and Bitcoin broke $83,000. Qatar, which is mediating with Pakistan, said talks were still going. Nothing is signed yet.
DISCOVER: Support and Resistance in Plain English: Floors, Ceilings and Why They Work
What Happened Last Time Bitcoin ETF Inflows Were This Big?
Bitcoin climbed from $76,011 to $87,399 in five days. The streak started on September 17, and over eight trading days the ETFs pulled in about $3 billion. The peak came on Monday, September 21: $999 million in one day, the biggest of 2026, led by IBIT with $381.4 million, ARK’s ARKB with $289.1 million and FBTC with $238.8 million. The next day added $714.7 million.
Bitcoin went straight up with it. September 21 alone opened at $81,180 and closed at $86,618, a 6.7% candle.
Then it stalled. BTC tested the $87,000 area again on September 23 and October 2 and got rejected both times. When the money turned, it turned hard: $484.9 million left on October 7, the biggest single-day outflow since June, and Bitcoin dropped to $80,400 the next day.
In other words, September had two things Monday doesn’t have yet: a streak of inflow days in a row, and three funds buying at once. Monday was one fund, one day.
EXPLORE: Indicators Worth Knowing: Moving Averages, RSI and Volume
Bitcoin Price Analysis: Can BTC Get Back to $87,000?
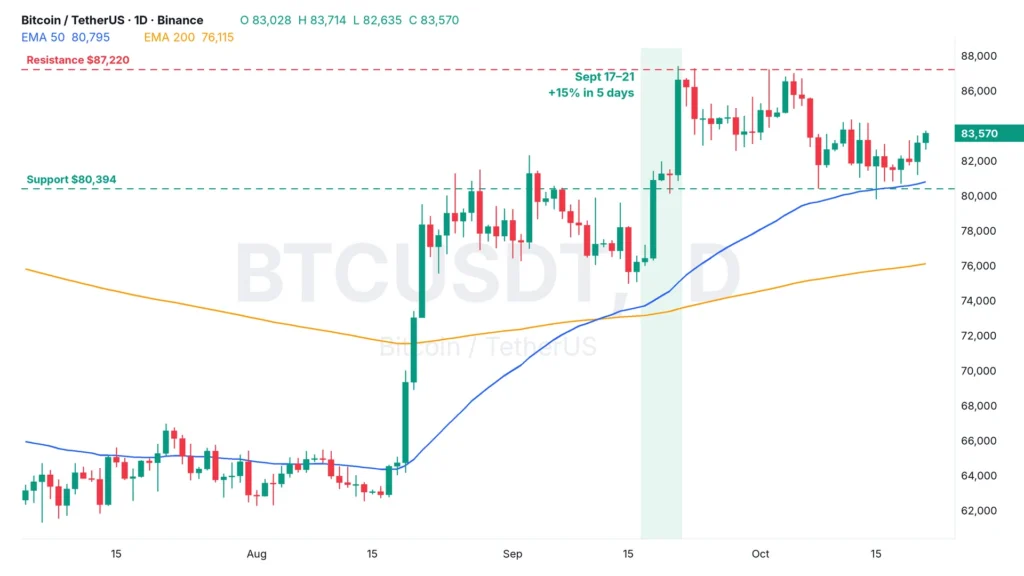
It can, but it needs more than one good day of flows. Bitcoin sits above its 50-day exponential moving average (EMA), a trend line that weights recent prices more, at $80,792, and well above the 200-day EMA at $76,115. The trend is still up.
The first hurdle is the October 14 high near $84,150. Above that, the real test is $87,220, the ceiling that stopped September’s run three times.
- In the bull case, a few more inflow days like Monday and a signed US-Iran deal would put $87,220 back in view.
- In the base case, Bitcoin keeps chopping between $80,394 and $84,150 while the funds go back to mixed days.
- In the bear case, a daily close below $80,394 would put the 200-day EMA near $76,115 back on the table.
Sponsored · Affiliate link
Save 20% on fees trading on WEEX
Base Camp may earn a commission if you sign up. It never affects what we write.

On the climb since 2017. Trades futures and reads onchain data. Automates the boring parts.
More from VikingXBT →