The short version
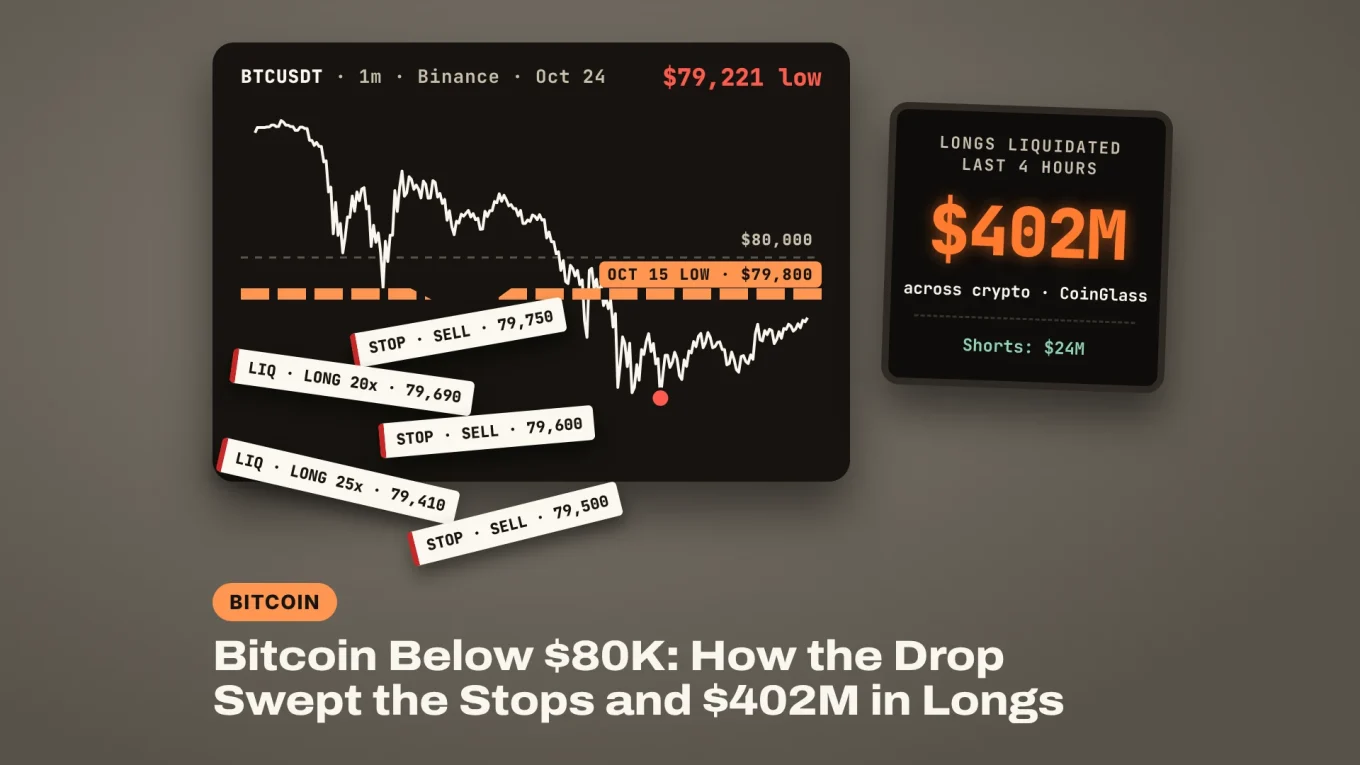
- Bitcoin below $80K: BTC broke the October 15 low of $79,800 on Saturday and hit $79,221 on Binance, its lowest price since September 18.
- CoinGlass counted $425 million in liquidations across crypto in four hours, $402 million of it longs, as the stops under $80,000 went off; funding stayed positive, so most of the leverage is still there.
- The crew is watching tonight’s daily close: back above $80,000 makes it a sweep, under $79,800 opens $77,600 and the 200-day EMA at $76,256.
Bitcoin below $80K was the trade everyone could see coming, and that was the problem. BTC broke the October 15 low of $79,800 on Saturday afternoon and fell to $79,221 on Binance, its lowest price since September 18. It trades at $79,550 at the time of writing, down 2.5% in 24 hours.
The drop took the longs with it. CoinGlass counted $425 million in liquidations across crypto in four hours, and $402 million of that came from traders betting on higher prices. So why did a floor that held for nine days give way in one hour, and is the selling done?
Glassnode flagged the risk ten days ago, when Bitcoin was still holding the cost basis of the spot ETFs:

BTC is holding the ETF cost basis. That line sits near $81.5K, and every daily close for the last 3 weeks has held above it. A large block of bids waits just below. A break under this level could set off forced selling and deepen the drop. x.com/i/article/2110…
Bitcoin Below $80K: How Many Longs Were Liquidated?
About $402 million across crypto in four hours, and 94.4% of everything liquidated in that window. CoinGlass put the four-hour total at $425.47 million by 15:45 UTC, with $401.67 million from longs and $23.80 million from shorts. Over 24 hours the tally reached $834.75 million and 221,803 traders.
BTC led the coins. Bitcoin liquidations came to $153.8 million in four hours, and 96.8% of it was longs. Ethereum added $133.1 million.
Binance carried half the damage at $221.3 million. Hyperliquid, the onchain perp exchange, came second at $70.3 million, and 99.9% of its liquidations were longs.
A liquidation is the exchange closing a leveraged trade because the margin behind it ran out. For a long, that is a forced market sell. Each one pushes the price down toward the next long’s liquidation price, which is how a slow afternoon turns into a liquidation cascade.
Sponsored · Affiliate link
Save 20% on fees trading on WEEX
Base Camp may earn a commission if you sign up. It never affects what we write.
Why Did Bitcoin Sweep the Stops Under $80K?
Because that is where the stops were. A round number and a recent low make the most obvious floor on the chart, and traders put their stop-loss orders and leverage just under it. That turns the floor into a pool of sell orders waiting to be triggered.
Bitcoin had two of those stacked together. $80,000 is the round number, and $79,800 was the October 15 low, the bottom of the range BTC had traded in since October 8. Glassnode’s weekly report adds a third reason: the spot ETFs and the corporate treasuries both bought their Bitcoin at an average between $80,000 and $81,500, and “a daily close below $80K would put both at a loss on average.”
The minute chart shows how the sweep played out:
- 14:27 UTC: the first test. BTC dipped to $79,833, $33 above the October 15 low, on $34 million of Binance spot volume in one minute, then bounced to $80,390.
- 15:04 UTC: back under $80,000, this time without a bounce.
- 15:09 to 15:10 UTC: through $79,800. Volume jumped to $12 million a minute as the stops under the low went off.
- 15:16 UTC: the biggest minute of the day, $28 million, and a drop to $79,280.
- 15:25 UTC: the low at $79,221.
The first dip stopped $33 short of the stops. The second one went through, and the forced selling did the rest. That is a liquidity sweep: price runs to where the orders sit, fills them, and only then decides where to go.
DISCOVER: Advanced Market Structure: Liquidity, Sweeps and Deviations
What Pushed Bitcoin Down Today?
No single headline, but a heavy week. US spot Bitcoin ETFs lost $635.6 million on Thursday and $137.9 million on Friday, per Farside. Brent crude settled at $116.72 on Friday, and oil above $110 has already nearly halved the Bitcoin mining stocks this month.
Then Arthur Hayes said on Saturday morning that he had sold the whole directional book at his family office, Maelstrom, because macro looks “dicey.” One of crypto’s loudest bulls going to cash four days before the Fed’s October 28 rate decision didn’t help the mood.
Saturdays also trade thin. With stock markets closed and fewer desks online, it takes less selling to push price into a level where the stops sit.
EXPLORE: Fed Meeting Next Week: Traders Bet on a Hold. What It Means for Bitcoin
Are Bitcoin Longs Still Crowded?
Mostly, yes. Funding on Bitcoin perpetuals stayed positive through the drop: 0.0058% per eight hours on OKX, and positive on Binance and Hyperliquid too. Positive funding means longs still pay shorts to keep their positions open.
Open interest barely moved. OKX’s BTC-USDT perpetual held 30,823 BTC in open contracts at the start of the 14:00 UTC hour and 30,281 BTC an hour later, a drop of only 1.8%. Binance’s Bitcoin open interest was flat over 24 hours at $7.56 billion.
That is a small flush. The longs closest to $80,000 are gone, but most of the leverage that bought this range is still in the market, and its next pool of stops sits lower.
Bitcoin Price Analysis: Can BTC Get Back Above $80K?
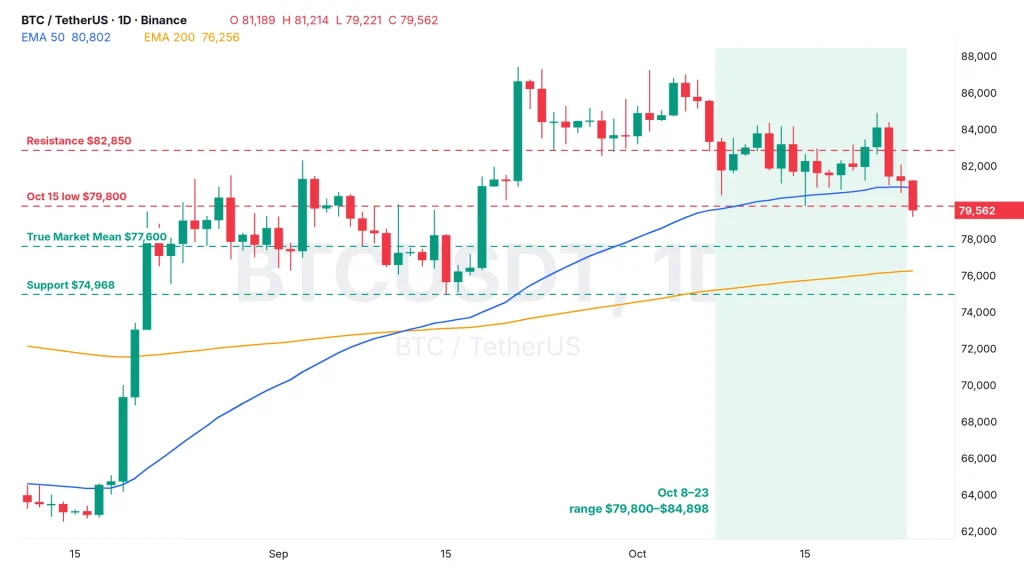
Not yet. The Bitcoin price sits at $79,550, under the old range floor at $79,800 and under the 50-day EMA at $80,802. BTC has closed above $80,000 every day since September 18 and above that EMA every day since mid-August, so tonight’s daily close matters more than the low.
The levels the crew is watching:
- Bull case: a daily close back above $80,000 turns today into a failed breakdown and puts $80,802, the 50-day EMA, in play. Swept lows that get reclaimed fast often trap the late shorts.
- Base case: a range between $77,600 and $80,000 into Wednesday’s Fed decision while the leverage left over works itself out.
- Bear case: a daily close under $79,800 confirms the break. Next is $77,600, Glassnode’s True Market Mean, the average cost of active investors, then the 200-day EMA at $76,256 and the September 15 low at $74,968.
Bitcoin below $80K took out the easy stops. Whether it was a sweep or the start of a move lower, tonight’s close at 00:00 UTC is the first answer.

On the climb since 2017. Trades futures and reads onchain data. Automates the boring parts.
More from VikingXBT →