The short version
- Bitcoin liquidation levels: CoinGlass’s Binance heatmap shows the nearest bands about 1% away, shorts at $81,000 to $81,600 and longs at $79,300 to $79,800.
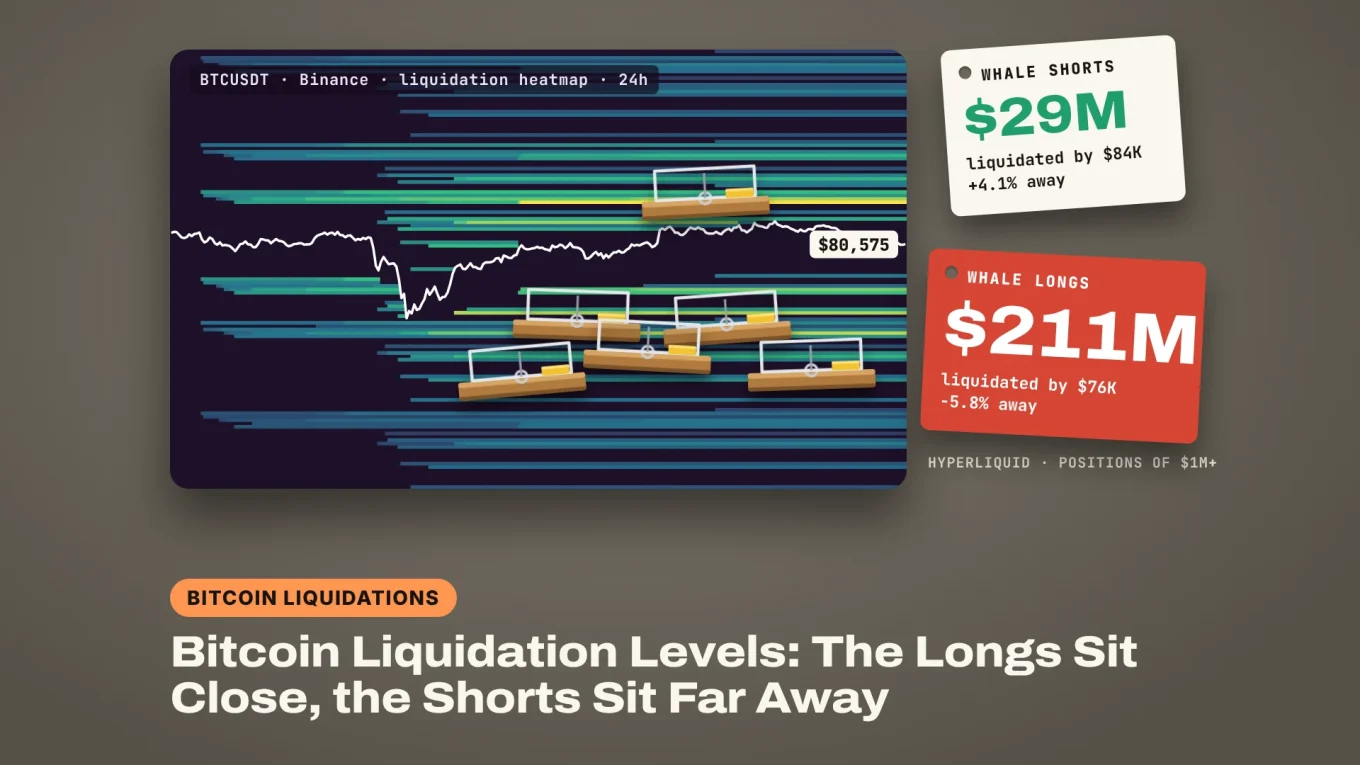
- Real Hyperliquid whale positions are lopsided: $96 million in longs get liquidated by $78,000 and $211 million by $76,000, while only $29 million in shorts break by $84,000.
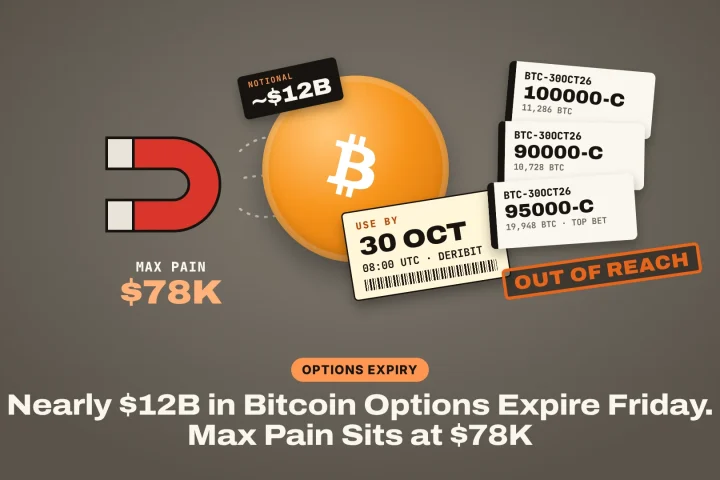
- The crew is watching $81,000 above and a daily close under $79,800 below, ahead of Wednesday’s Fed decision and Friday’s $12 billion options expiry.
Bitcoin liquidation levels are the closest thing traders have to a map of where the next fast move could start. BTC trades at $80,700 at the time of writing, back above $80,000 after Saturday’s sweep to $79,221, and the leverage around it is lopsided.
On Hyperliquid, where every position is public, $96 million in big long bets would be force-closed if Bitcoin drops to $78,000. To force-close the same amount of shorts, BTC would have to climb past $90,000. So where exactly do the liquidations sit, and how big a move would it take to set them off?
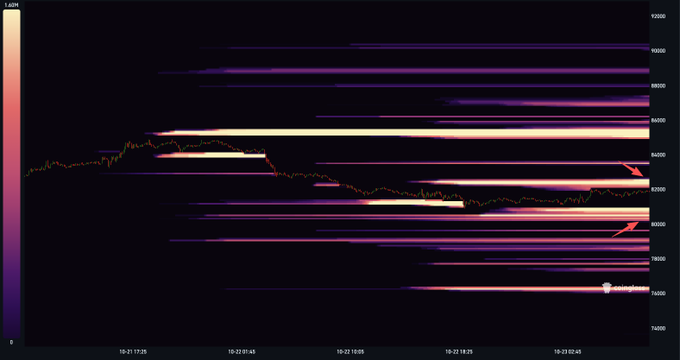
CoinGlass had marked the lower magnet two days before it got hit:

$BTC Liquidation Heatmap (48 hour)
High leverage liquidity. 🧐
🧲$82.3K
🧲$80.3K
Where Are the Bitcoin Liquidation Levels Right Now?
The nearest pools sit about 1% on either side of the price. CoinGlass’s liquidation heatmap for Binance’s BTC-USDT perpetual, the biggest Bitcoin futures market, put the brightest band above at $81,000 to $81,600, worth an estimated $182 million, with the strongest single level at $81,335.
Below, it shows two bands: $79,300 to $79,800, about $144 million, and $78,500 to $79,000, about $139 million. Above $82,300 the bands thin out fast.
A liquidation heatmap is a map of where leveraged traders would be forced out. Each band is a price where enough positions would hit their liquidation price for the exchange to close them with market orders. Shorts get bought back above the price, longs get sold below it.
That’s why traders call these bands magnets. Price that reaches one tends to run through it, because every forced order pushes it toward the next.
Sponsored · Affiliate link
Save 20% on fees trading on WEEX
Base Camp may earn a commission if you sign up. It never affects what we write.
What Do the Hyperliquid Whale Positions Show?
The longs are much closer. Hyperliquid, the onchain perp exchange, shows every open position, and CoinGlass tracks 343 Bitcoin positions of $1 million or more there, about $2.6 billion in total.
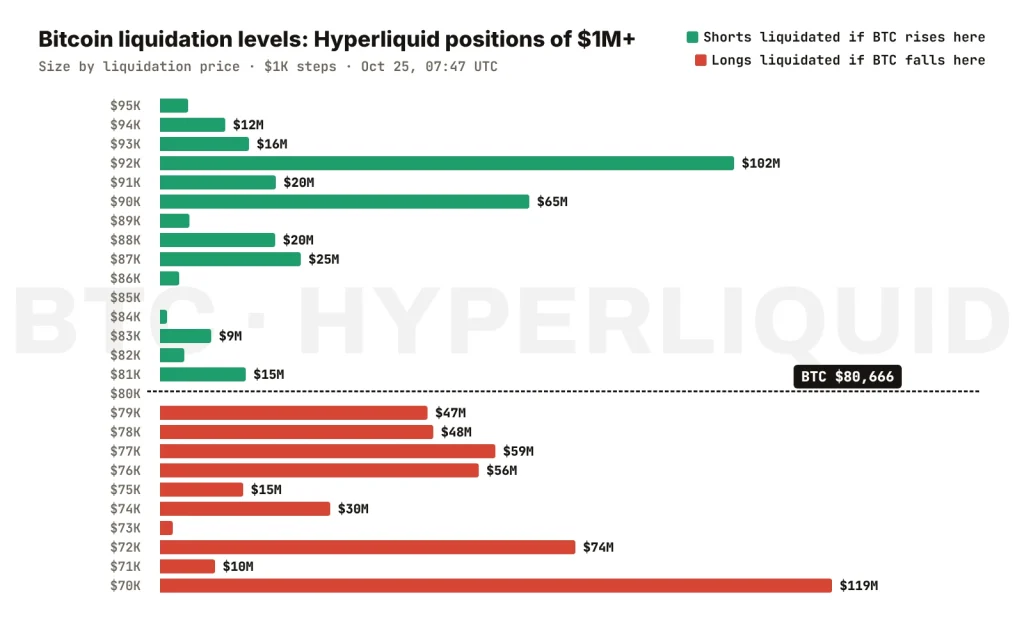
Sorted by liquidation price, the lopsidedness is plain:
- Longs: $47 million gets liquidated by $79,000, $96 million by $78,000 and $211 million by $76,000.
- Shorts: just $29 million by $84,000, $58 million by $88,000 and $169 million by $92,000.
In other words, a 6% drop would clear more whale leverage than a 14% rally. Ten of the 13 longs that get liquidated between $79,000 and $80,000 run 40x leverage, which leaves room for a move of only about 2% before the margin is gone.
The biggest name close to the price is a wallet starting 0x30af. It holds a 248.67 BTC long worth $20.1 million, opened at $80,237.90 with 40x leverage, and its liquidation price sits at $79,255. That is $34 above Saturday’s low, so a repeat of Saturday’s drop would take it out.
Further down sits the whale flagged on October 19 with $140.88 million in BTC and ETH longs. Its Bitcoin position is still open: 1,235.66 BTC, worth $99.7 million, at 12x leverage with a liquidation price of $70,506.
How Big a Move Would Trigger Them?
Small ones on Binance, bigger ones for the Hyperliquid whales. Measured from $80,700:
| Level | Move from $80,700 | What sits there |
|---|---|---|
| $81,000 to $81,600 | +0.4% to +1.1% | Binance’s brightest short band, about $182M (estimate) |
| $79,300 to $79,800 | −1.1% to −1.7% | Binance long band, about $144M (estimate) |
| $79,255 | −1.8% | The 0x30af whale’s $20.1M long |
| $78,000 | −3.3% | $96M of Hyperliquid whale longs gone by here |
| $76,000 | −5.8% | $211M of Hyperliquid whale longs gone by here |
| $84,000 | +4.1% | Only $29M of Hyperliquid whale shorts gone by here |
| $92,000 | +14.0% | $169M of Hyperliquid whale shorts gone by here |
The pattern fits what Glassnode wrote on October 21: the largest liquidation clusters above the price share a zone with the Binance sell orders, around $87,000. That is a long way from here.
Are Bitcoin Traders Still Leaning Long?
Yes, mildly. The funding rate on Bitcoin perpetuals is positive everywhere that matters: 0.0060% per eight hours on Binance, 0.0076% on Bybit, 0.0094% on OKX and about 0.0073% per eight hours on Hyperliquid. Positive means longs pay shorts, but all four sit under the 0.01% baseline that counts as normal.
On OKX, 2.06 accounts are long BTC for every one that is short. That is a crowd count, not a size count, but it shows where the retail side leans.
Open interest, the total value of open futures, barely moved through Saturday’s flush. Binance’s BTC-USDT perpetual holds $7.52 billion, and Bitcoin futures on all the exchanges CoinGlass tracks add up to about $44 billion. The longs closest to $80,000 got cleared on Saturday. The ones a few percent lower are still there.
DISCOVER: Funding Rates and Open Interest: Reading the Crowd
Can You Trust a Liquidation Heatmap?
As a map of pressure, yes. As a list of orders, no. Binance doesn’t publish its traders’ liquidation prices. The heatmap is CoinGlass’s estimate, built from open interest, price history and common leverage levels, and other models draw the bands in other places.
The Hyperliquid numbers are real positions, but they only cover the big wallets on one exchange, and a whale can add margin, cut size or close in a minute. A level that shows $20 million today can be empty tonight.
Bitcoin liquidations still cluster where the heatmaps say often enough to matter. Use both as a guide to where a move could speed up, never as a promise that price will go there.
EXPLORE: Futures and Leverage: How Liquidation Really Works
Bitcoin Price Analysis: Which Liquidation Pool Gets Hit First?
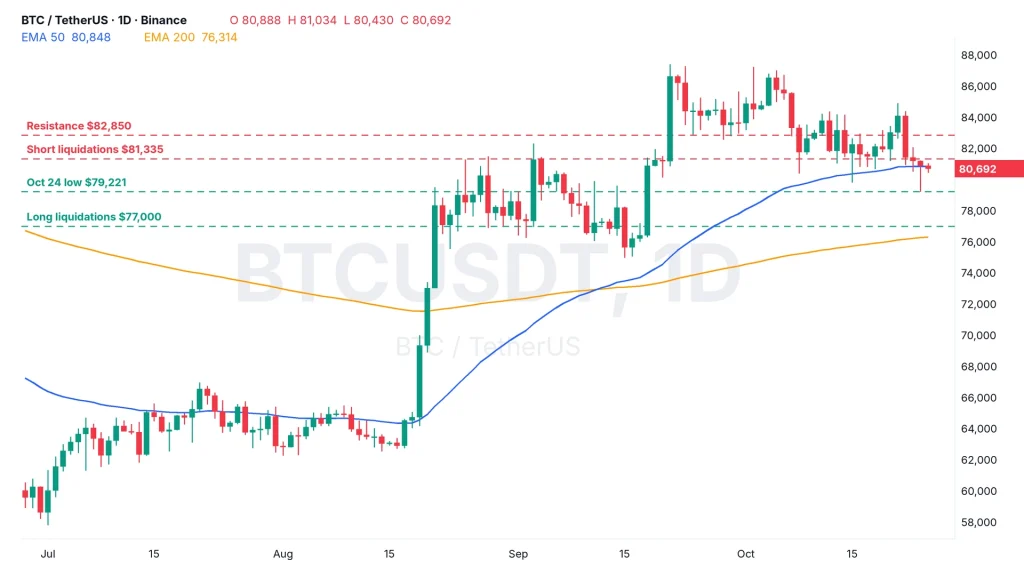
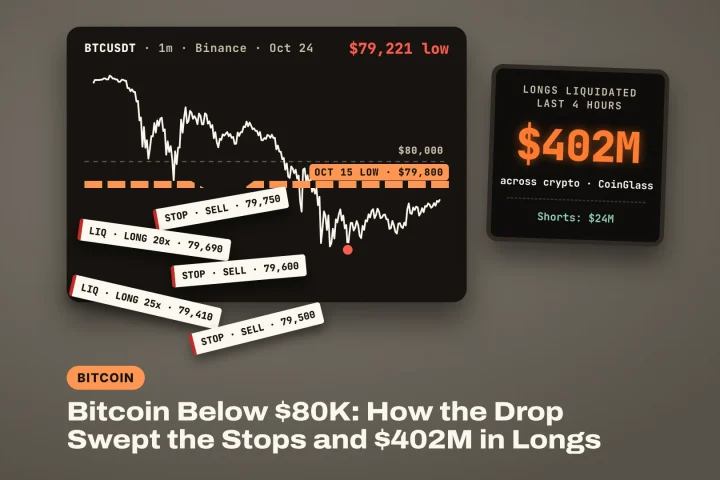
The one above is closer, but the one below is bigger. BTC closed Saturday at $80,888, back above $80,000 after the sweep under the October 15 low, and now sits right under the 50-day EMA at $80,848, the average that weights recent prices more.
The levels the crew is watching:
- Bull case: a push through $81,000 runs into the $81,000 to $81,600 short band, and the forced buying could carry BTC to $82,850, the next resistance on the daily chart.
- Base case: a range between $79,300 and $81,600 into Wednesday’s Fed decision and Friday’s $12 billion options expiry, with max pain at $78,000.
- Bear case: a daily close back under $79,800 puts the 40x longs at $79,255 and below in play, then the $76,000 to $78,000 pocket and the 200-day EMA at $76,314.
Bitcoin liquidation levels point one way this weekend. The shorts are thin until $87,000, the longs are packed down to $76,000, and a break lower has more fuel to keep going.