
The short version
- Is Bitcoin in a bear market? A note CryptoQuant shared says a sustained break below $73,000 followed by a failed retest would strengthen the case, with BTC about 1.8% above it.
- CryptoQuant’s Bull Score fell from 20 in Tuesday’s report to 0 on Wednesday, the most bearish reading possible, while USDT supply shrank $6.6 billion in 60 days.
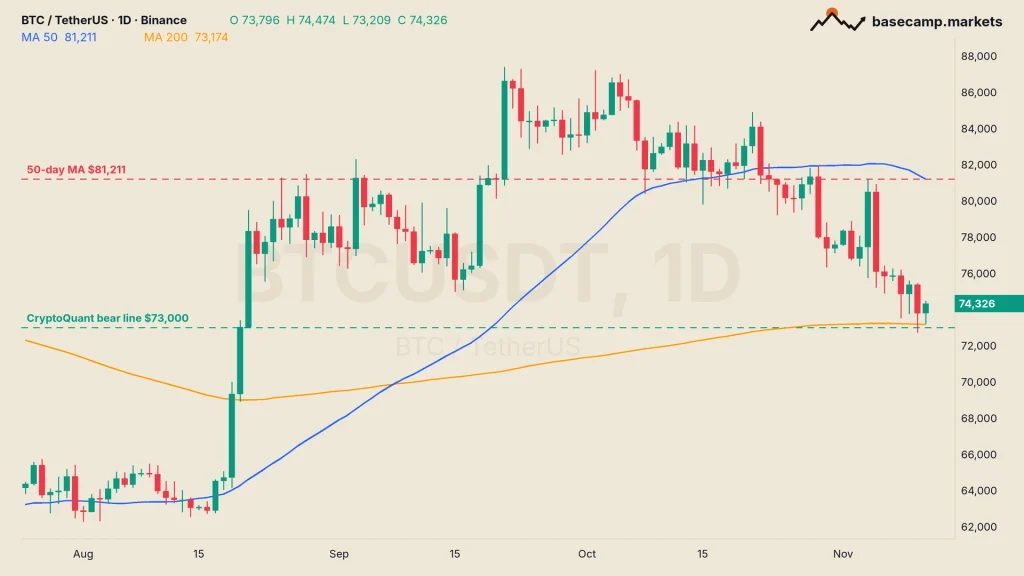
- Tuesday’s dip to $72,727 was the first trade under $73,000 since August 20, but the daily close held above it, with the 200-day moving average at $73,174.
- Next: the weekly close at 00:00 UTC on Monday, November 16 (7:00 p.m. Sunday in New York), and whether BTC is still above $73,000 at it. Follow Base Camp on X for the levels as they move.
“A sustained break below $73,000 followed by a failed retest from below would strengthen the case for bear-market continuation.”
That line comes from a note by analyst I. Moreno that on-chain data firm CryptoQuant shared on Wednesday morning. Bitcoin trades at $74,300 at the time of writing. That leaves about $1,300 of room, or 1.8%. On Tuesday the gap closed completely for a moment: BTC dipped to $72,727 on Binance before buyers pulled it back.
A few hours later, CryptoQuant’s head of research said its Bull Score had hit 0. So is Bitcoin in a bear market, or is $73,000 still a floor worth trusting?
CryptoQuant put the level in plain words:

Is Bitcoin’s Risk-Reward Improving as the Rebound Weakens?
“A sustained break below $73,000 followed by a failed retest from below would strengthen the case for bear-market continuation.” – By @MorenoDV_
What CryptoQuant’s $73,000 Line Actually Means
It takes two steps. A wick under $73,000 doesn’t count. The note wants a sustained break, then a bounce that tries to win the level back from below and fails. That’s when old support turns into resistance, and the line becomes a ceiling.
Tuesday did half of it. Bitcoin traded under $73,000 for the first time since August 20, then closed the day at $73,796. No sustained break. Not yet.
The level isn’t random. On August 20 Bitcoin closed at $73,025, and the next day it ripped to a $78,338 close without looking back. That jump started the run to $87,396 on September 21. The 200-day moving average, the average daily close of the last 200 days, now sits at $73,174, right on top of it. Two lines in one spot. The last daily close below $73,000 was August 19.
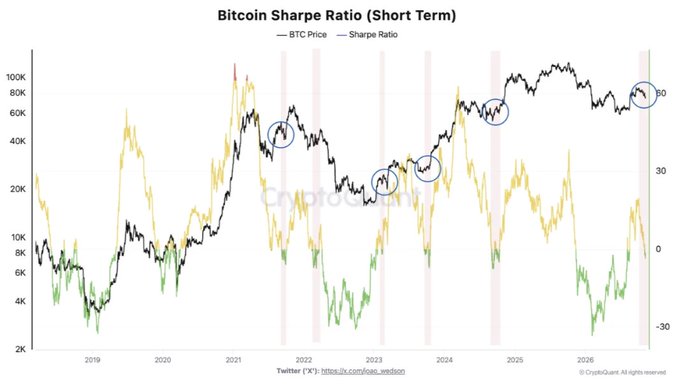
The charts in the note explain why the line matters now. CryptoQuant’s short-term holder chart puts the realized price of coins held for less than about five months at roughly $75,500. That is their average cost. Bitcoin is under it, so the average recent buyer is now sitting on a loss. Another chart shows their unrealized profit dipping just below zero for the first time since August.
Recent buyers under water tend to sell bounces to get out flat. A failed retest would be exactly that.
Sponsored · Affiliate link
Save 20% on fees trading on WEEX
Base Camp may earn a commission if you sign up. It never affects what we write.
Is Bitcoin in a Bear Market Yet? What the Bull Score Says
On CryptoQuant’s own numbers, the bulls have lost the argument for now. The firm’s weekly report on Tuesday, titled Razor’s Edge: Local Bottom or Deeper Correction?, put the CryptoQuant Bull Score at 20 out of 100, with demand for Bitcoin contracting at its fastest pace since March 2025.
A day later it was lower still. Julio Moreno, CryptoQuant’s head of research, posted the new reading on Wednesday afternoon:

Our Bitcoin Bull Score is at 0, the most bearish it can be.
Local Bottom or Deeper Correction?
Our latest report in the comments.
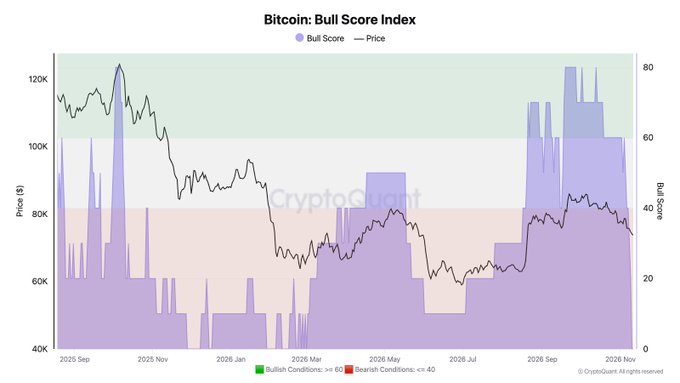
Zero. The most bearish it can be. On his chart, anything at 40 or below counts as bearish, and the score still touched 80 in October. Most of that fall came in November.
Analysts have noticed. CryptoQuant’s Analyst Consensus Index, which scores the tone of published Bitcoin research against its own history, fell from -1.0 to -1.8 standard deviations in seven days. CryptoQuant blames ETF outflows, inflation worries and a weak Nasdaq. The ETF part is easy to see: BlackRock’s IBIT just posted its eighth straight day of outflows.
SIDE TRAIL: Bitcoin ETF Outflows Slow to $95M, but IBIT Bleeds for an 8th Straight Session
The fuel is draining too. CryptoQuant shows the USDT market cap down $6.6 billion in 60 days as of November 7, the biggest 60-day drop in its series, which starts in 2022. For context, the drop after FTX collapsed bottomed out at $3.2 billion. Tether’s stablecoin is what most traders park cash in before they buy, so less of it means less money waiting on the sidelines.
Still, the report’s summary doesn’t pick a side. “Every cycle indicator has turned bearish at once,” it reads. “That is what a local bottom looks like, and also how a deeper correction starts.”
That’s the honest version. The data alone can’t tell you which one this is. Price at $73,000 can. The Fear & Greed Index sits at 29, in Fear, and gloom this thick is usually where shorts start to crowd.
BTC Price Analysis: How Close Is Bitcoin to the Line?
Close enough to touch. Bitcoin has dropped 7.6% in a week and sits 41% under its $126,080 all-time high from October 6, 2025.
By the textbook rule, a 20% fall from the top, that was a bear market a long time ago. That’s why the note says “continuation.” So asking “is Bitcoin in a bear market” misses the point a little. The real question is whether the rebound from the summer low, which took BTC from $57,800 on July 1 to $87,396 in September, is over.
On the daily chart, the trend already turned. Bitcoin has traded mostly under its 50-day moving average since late October, and the November 4 bounce stalled at $81,196 before giving most of it back the next day. The 50-day now sits at $81,211 and is starting to point down.
The weekly chart is no kinder. Last week closed at $74,851, the fifth red week in a row and the first close under the 50-week moving average since September.
The levels that matter:
- $81,211: the 50-day moving average. Back above it, and the whole bear argument loses its footing.
- $75,500: roughly where CryptoQuant puts the short-term holder realized price. Reclaiming it puts recent buyers back in profit.
- $73,174 to $73,000: the 200-day moving average and CryptoQuant’s line. This is the one.
- $72,727: Tuesday’s low. A daily close under it is the sustained break.
- $69,335: the August 19 close, the last daily close below $73,000 before the breakout.
TRAIL MAP: On-Chain Metrics That Matter: MVRV, Realized Price and Exchange Flows
One caveat, and it matters. CryptoQuant didn’t say a break makes it a bear market. The note said a break and a failed retest would strengthen the case. That second step can take days or weeks.
Watch the retest, not the wick.

TheCryptoMonk has been trading since 2017 and reads the market from the top down. The focus is macro and the high timeframes: where stocks, rates and liquidity are heading, and what the weekly and monthly charts say about Bitcoin. Short-term noise matters less than the bigger trend.
More from TheCryptoMonk