
The short version
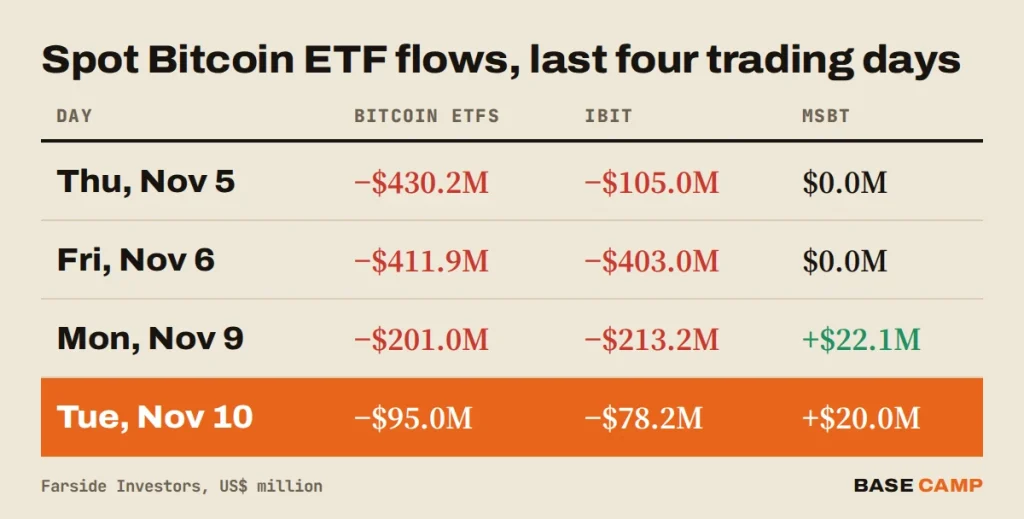
- Bitcoin ETF outflows slowed to $95.0 million on November 10, less than half of Monday’s $201.0 million, even with October’s CPI running hot.
- BlackRock’s IBIT still lost $78.2 million, its eighth red session in a row and $1.73 billion since October 30, while Morgan Stanley’s MSBT took in $20.0 million.
- Next: whether IBIT gets its first green day since October 29 in Wednesday’s flows, which Farside posts after the US close.
$95.0 million. That is what US spot Bitcoin ETFs lost on Tuesday, November 10, less than half of Monday’s $201.0 million and the smallest exit of a four-day red run. The catch: BlackRock’s IBIT lost $78.2 million of it, its eighth red session in a row.
Fidelity’s FBTC added $36.8 million to the Bitcoin ETF outflows, while Morgan Stanley’s MSBT took in $20.0 million, the only fund with money coming in for a second day running. All of it happened on the day October’s inflation report came in hot. So did the CPI scare the funds, or did they shrug it off?
Farside’s Tuesday post has every fund:

Bitcoin ETF Daily Flow – US$
Blackrock ($IBIT): -78.2 million
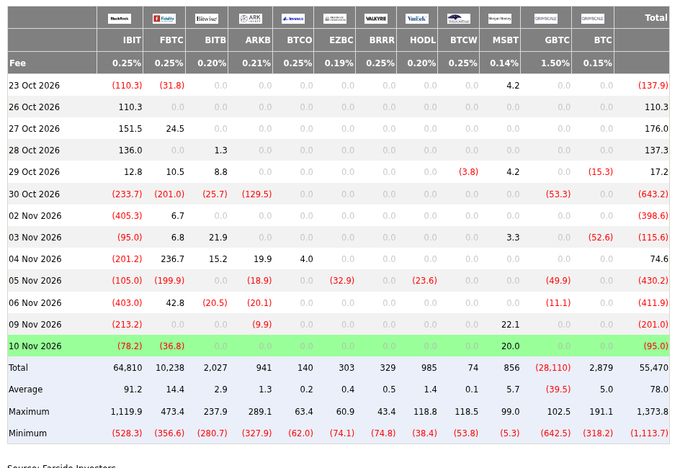
IBIT Outflows Reach $1.73 Billion in Eight Sessions
IBIT has now lost $1.73 billion since October 30, per Farside, and Tuesday’s $78.2 million was the smallest of those eight days. The two worst were $405.3 million on November 2 and $403.0 million last Friday. So the bleeding hasn’t stopped. It has slowed to a trickle next to last week.
Fidelity’s $36.8 million was its first outflow since last Thursday’s $199.9 million, and the other nine funds reported zero. That makes Tuesday less of an IBIT-only story than Friday, when BlackRock’s fund was almost the whole $411.9 million.
Size matters here, too. IBIT still sits on $64.81 billion of net inflows since launch on Farside’s count, so eight red days barely show on that scale. MSBT is the odd one out: $22.1 million on Monday, $20.0 million on Tuesday, and a fee of 0.14% a year against IBIT’s 0.25%.
Sponsored · Affiliate link
Save 20% on fees trading on WEEX
Base Camp may earn a commission if you sign up. It never affects what we write.
Did the Hot CPI Make Bitcoin ETF Outflows Worse?
Not on Tuesday’s numbers. US consumer prices rose 0.4% in October and core prices 0.3%, both above forecast, yet Bitcoin ETF outflows came in at less than half of Monday’s.
The bigger picture is still red. The four losing sessions since November 5 add up to $1.14 billion, and November stands at $1.58 billion out after seven sessions, about three times the $515.9 million that left in all of October. Since launch, the group still holds $55.47 billion of net inflows.
One quieter day doesn’t end a streak, though. What would? A green day from IBIT, which hasn’t had one since October 29. Until then, IBIT outflows set the tone for the whole group.
SIDE TRAIL: Bitcoin ETF Outflows Hit $201M as IBIT Goes Red for a 7th Day
Bitcoin Price: Clinging to the 200-Day Average
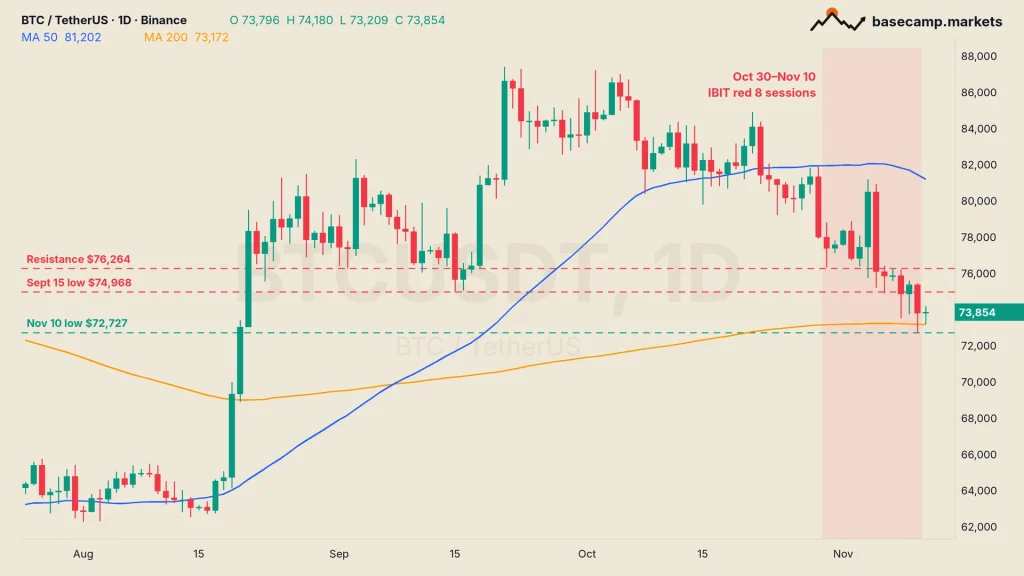
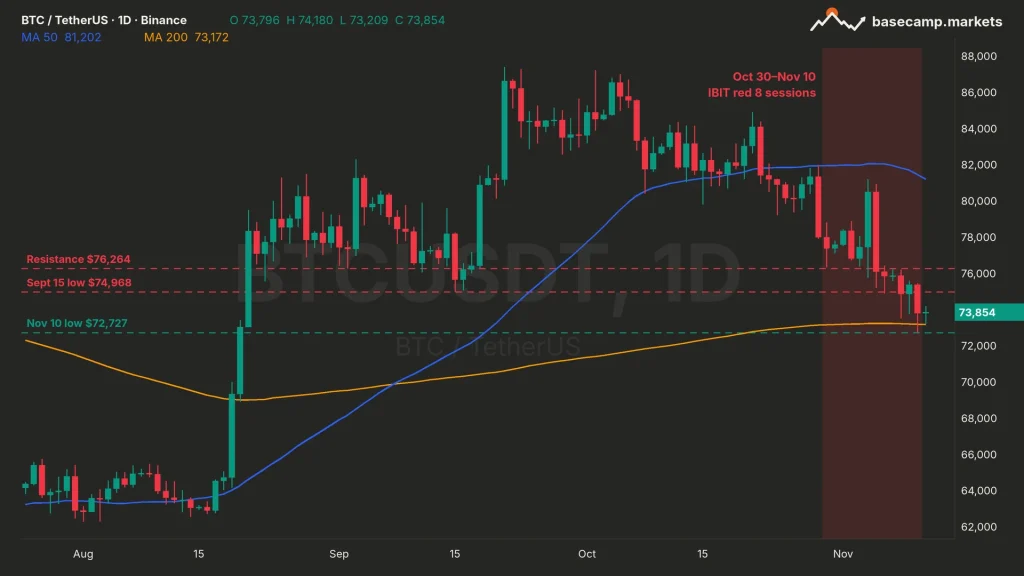
The BTC price is $73,804 at the time of writing, just above its 200-day moving average at $73,172, the average close of the last 200 days that many traders read as the line between a pullback and a downtrend. Tuesday’s CPI candle dipped to $72,727, under that line, then closed back above it at $73,796.
- Resistance: $74,968, the September 15 low, lost again on Tuesday, then $76,264.
- Support: the 200-day MA at $73,172, then Tuesday’s low at $72,727.
A daily close back over $74,968 would be the first sign the sellers are tiring. A daily close under $72,727 would also be BTC’s first close under the 200-day since August 18.
TRAIL MAP: CPI Report Today: Core Inflation Runs Hot at 0.3%, Bitcoin Slips
The 50-day average sits far above at $81,202, and the Fear & Greed index reads 29.

TANG has been trading crypto since 2017. The focus is technicals, DeFi and onchain data. On the chart, that means high-timeframe support, moving averages and momentum divergences. Onchain, it means regular checkups on where the data puts the cycle. TANG once ran CryptoJungle, a free community for researching and trading together, and brings that same spirit to Base Camp as one of its co-founders.
More from TANG