The short version
- PPI report Friday: October producer prices land at 13:30 UTC, with a 0.4% rise expected after September’s 1.3% jump.
- It is the last fresh inflation data before the Fed meets on December 8–9, and Kalshi already prices a quarter-point hike at 86%.
- Bitcoin sits at $73,830, just above its 200-day moving average at $73,172, after a dip to $72,727 on Tuesday.
- Next: the PPI print on Friday at 13:30 UTC (8:30 a.m. in Washington), then October’s PCE on November 25.
Tuesday’s CPI did the heavy lifting, and Friday’s PPI report gets the last word. US consumer prices rose 0.4% in October and core rose 0.3%, both a tenth above forecast, and traders now treat a December rate hike as close to a done deal.
On Kalshi, a quarter-point hike at the December 8–9 meeting trades at 86%. A half-point move sits at 12%. A hold? Just 4%.
Producer prices land on Friday, November 13, at 13:30 UTC (8:30 a.m. in Washington). That is the last fresh inflation data before the Fed decides. Bitcoin trades at $73,830 at the time of writing, barely above its 200-day moving average. So can one more number change the call, and how much room does BTC have if it runs hot?
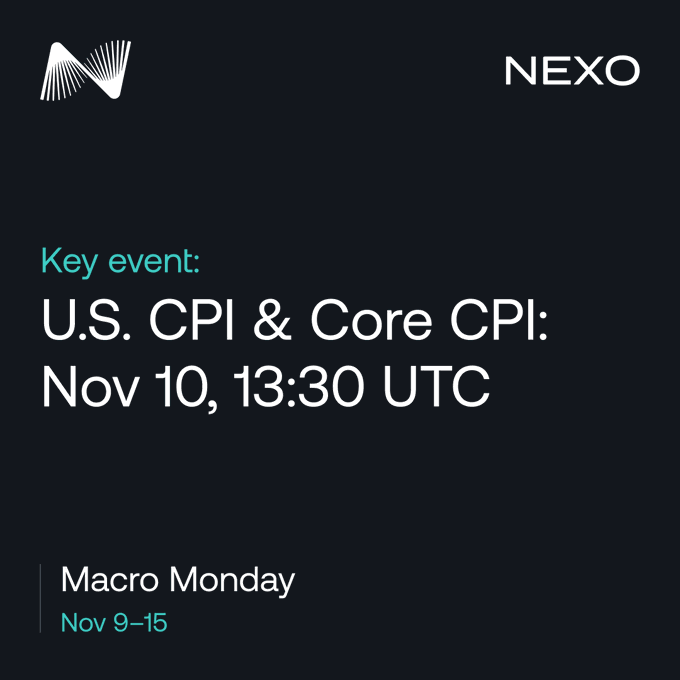
Nexo laid out the week on Monday, with Friday’s PPI as the last US inflation print on the list:

The Fed raised rates in September. This week, inflation gets to answer.
October’s CPI is the first report covering a full month since the hike and the last one before the Fed meets again on December 9. It arrives after a jobs report that came in at 165,000 against 65,000
What Is Expected From the PPI Report?
Another rise, but nothing like September. Market calendars show a consensus of 0.4% for October’s headline PPI, after a 1.3% jump in September that was the biggest since March 2022, the Bureau of Labor Statistics said.
The run-down for Friday:
- PPI final demand, October: 0.4% expected, 1.3% in September, 0.5% in August.
- Energy: up 10.8% in September alone, the main driver of that jump.
- Services: up 0.8% in September, after 0.2% in August.
- 12-month rate: 6.3% in September. Unlike CPI, PPI still publishes a yearly rate.
PPI tracks what businesses get paid for goods and services, before anything reaches a shop shelf. Rising costs there tend to reach consumers later.
Kalshi has a market on the exact print, and it leans slightly hotter than the consensus. Traders give a better than even chance that October comes in above 0.4%:
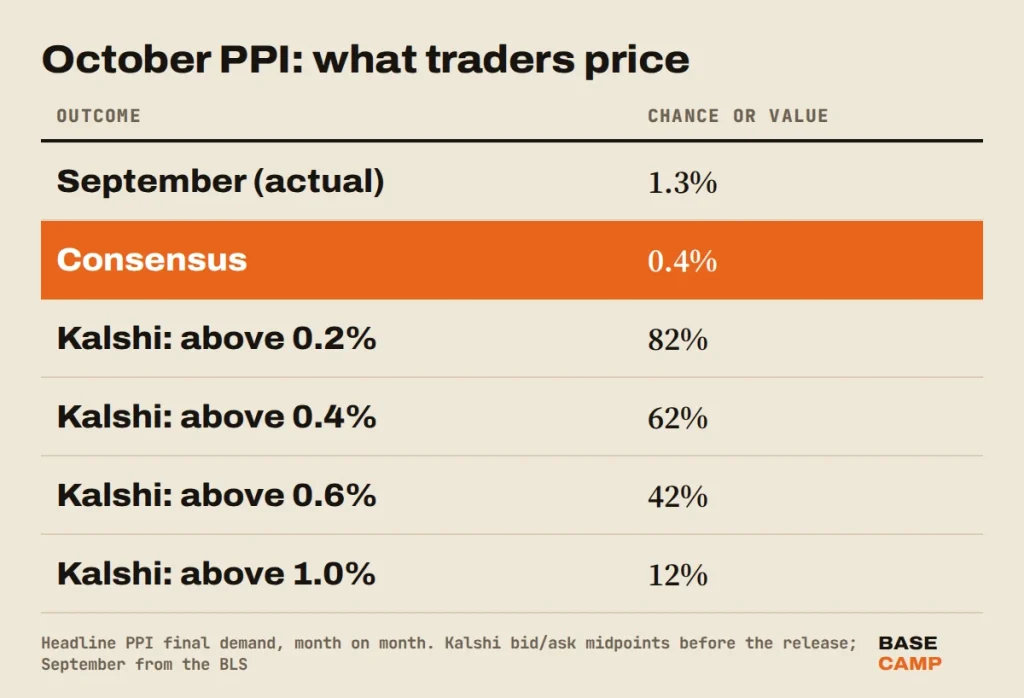
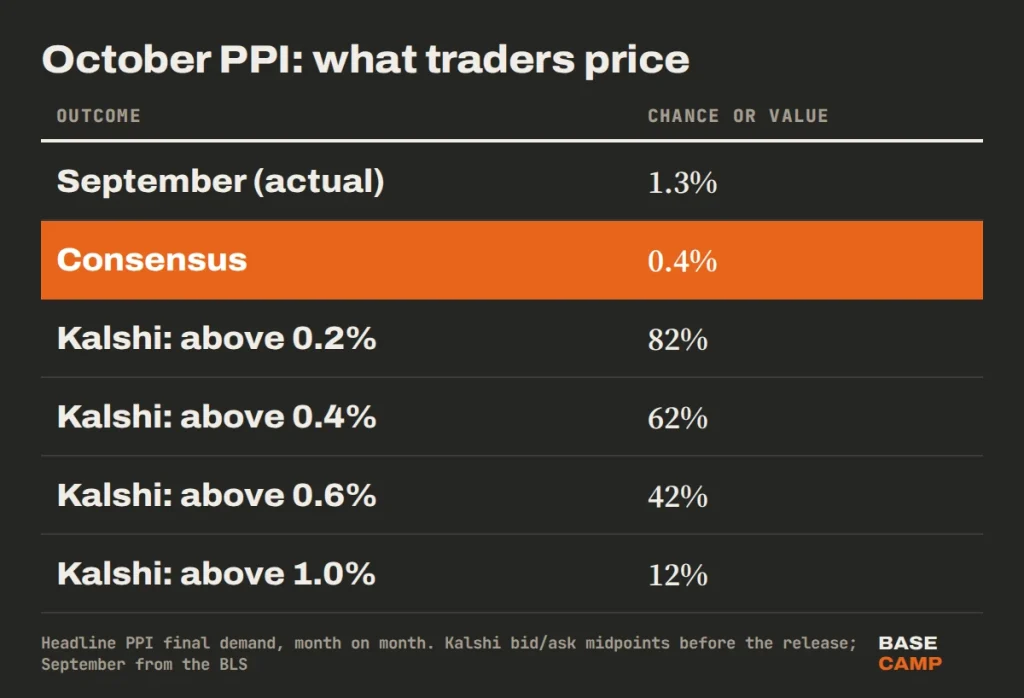
It’s a thin market next to the Fed one, so read it as a lean.
Sponsored · Affiliate link
Save 20% on fees trading on WEEX
Base Camp may earn a commission if you sign up. It never affects what we write.
Why Producer Prices Matter for the December Hike
The Fed’s preferred inflation gauge is the PCE price index, not CPI. And a good part of PCE is built from PPI data: airfares, doctor and hospital fees, and portfolio management charges all feed in from the producer side.
October’s PCE is due on November 25 at 13:30 UTC, according to the Bureau of Economic Analysis schedule. Economists will have worked out most of it from Tuesday’s CPI and Friday’s PPI. In other words, Friday is the last real inflation surprise before December 9.
The chain runs both ways:
- A hot PPI, at 0.6% or more, with services strong again, would back up the hot core CPI. The half-point odds at 12% are the ones that would move.
- A cool PPI, at 0.2% or lower, would not cancel a third straight 0.3% core CPI. It could take the edge off the half-point talk and give a hold a few points back.
The Fed held rates at 3.75–4.00% at its October meeting. December also brings fresh projections, the dot plot of where each official sees rates going, so the PPI report feeds the path for 2027 as well as the December move.
How the December Hike Odds Got to 86%
Fast. Three data points in five days did it:
- Friday, November 6: the US added 165,000 jobs in October, against roughly 65,000 expected. Hike odds jumped the same evening.
- Monday, November 9: Kalshi had a quarter-point December hike at 77%, and a half point at 2%.
- Tuesday, November 10: the odds hit 81% before CPI and 86% after it, while the half-point bet jumped to 13%.
Since then, barely a move. The quarter-point odds still trade at 86%, and the half point has eased to 12%. In other words, traders already expect a hike and are now arguing about its size.
Options traders were hedging the downside even before CPI. Derive’s weekly outlook on Monday listed Friday’s PPI at a 0.4% forecast and found the biggest Bitcoin options flows in put spreads, protection from $72,000 down to $70,000:

That’s where Friday comes in. Nobody needs the PPI report to believe in a December hike anymore. It can only make the case for a bigger one stronger, or take some of the heat out of it.
For Bitcoin, the size matters more than the hike itself. A quarter point is mostly in the price already, after a 5.8% drop in a week. A real shot at half a point is not, and that is the scenario a hot PPI would put back on the table, with a firmer dollar and higher Treasury yields to go with it.
SIDE TRAIL: CPI Report Today: Core Inflation Runs Hot at 0.3%, Bitcoin Slips
Bitcoin Price Before the PPI Report: Levels to Watch
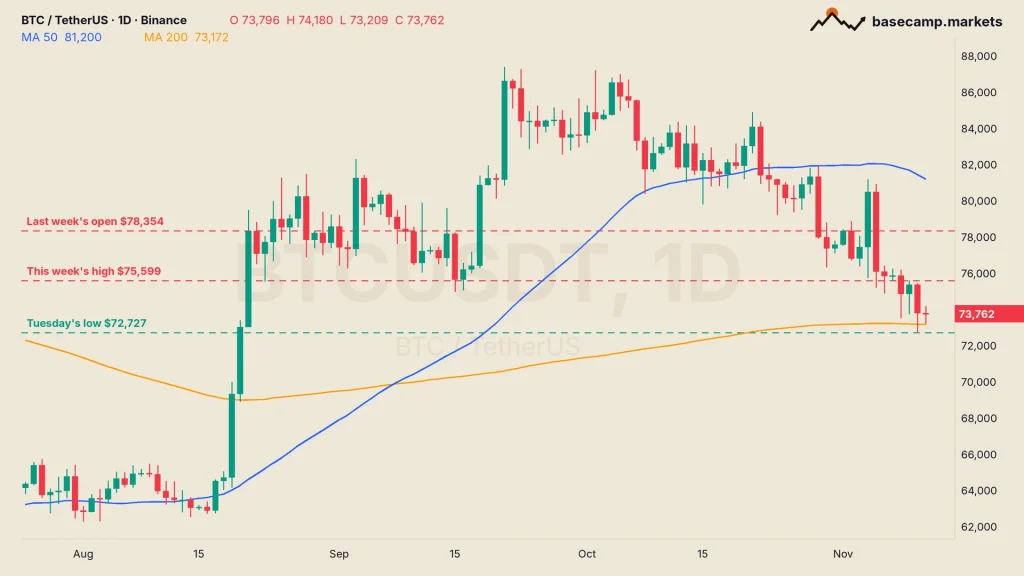
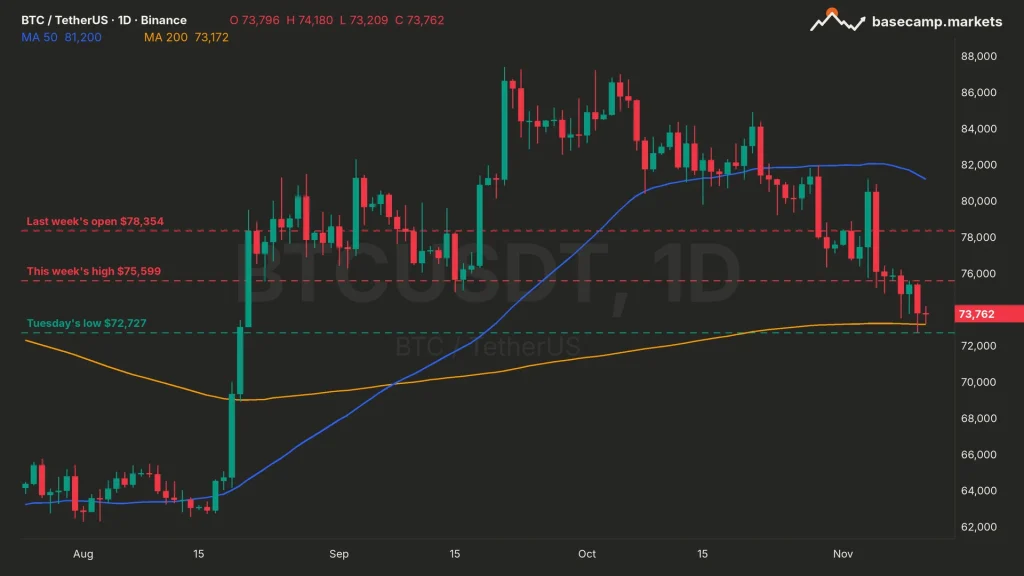
The Bitcoin price is down 5.8% in a week and 11% in a month, and it heads into Friday’s data near its lows. BTC dipped to $72,727 on Tuesday, CPI day, the lowest since August 20, before buyers pulled it back above the 200-day moving average (MA), the average close of the last 200 days, at $73,172.
The funds aren’t helping. US spot Bitcoin ETFs lost $95.0 million on Tuesday, their fourth red day in a row, according to Farside. The Fear & Greed index reads 29, which is fear.
The levels that matter into Friday:
- $72,727: Tuesday’s low. Just under it sits the 50% Fibonacci retracement at $72,598, then the 61.8% level at $69,106.
- $73,172: the 200-day MA. Tuesday’s close at $73,796 held it, barely.
- $75,599: this week’s high and the first ceiling.
- $78,354: last week’s open, the level that would undo November’s drop so far.
Ethereum is weaker still, at $2,057 and down 11% in a week, under its own 200-day MA at $2,152. On macro days, altcoins tend to move further than BTC in both directions.
TRAIL MAP: Crypto Trading Plan: Free One-Page Template
The odds will move at 13:30 UTC on Friday. The Fed’s answer comes on December 9 at 19:00 UTC (2:00 p.m. in Washington).

Satoshi Flipper has more than 20 years of trading experience, starting in stocks before moving into crypto in 2017, and holds an MBA from the Kellogg School of Management. The edge is reading the economic data: rate decisions, inflation, jobs numbers, earnings and the US markets that move Bitcoin.
More from Satoshi Flipper