
The short version
- Bitcoin price recovery: BTC trades at $60,886, up 10.4% from Saturday’s $55,130 low on Binance, its lowest price since September 2024.
- Arthur Hayes says $50,000 is the next real test if the Nasdaq keeps falling, after the Nasdaq Composite lost 5.28% on Friday.
- So far the weekend disagrees: Hyperliquid’s Nasdaq-100 perp trades 2.4% above Friday’s close, and Binance traders turned short into the low.
- Next: the weekly close at 00:00 UTC, an hour after Nasdaq futures reopen. Follow Base Camp on X for the Monday open.
10.4%. That is how far Bitcoin has climbed since Saturday morning, when it hit $55,130 on Binance. Bitcoin hadn’t traded that low since September 2024.
BTC trades at $60,886 at the time of writing, back above $60,000 for a second day, with a weekend high of $61,670. Ethereum did a little better: $1,703.90, up 10.8% from its own Saturday low of $1,538. The Bitcoin price recovery came with Wall Street shut and the spot ETFs closed, so nobody in New York has voted on it yet.
Arthur Hayes isn’t buying it. The BitMEX co-founder posted on Saturday evening, with BTC already back near $60,400, that the next leg depends on stocks:

$BTC just decisively broke below the previous local low. If Nasdaq keeps puking, $50,000 will be the next real test.
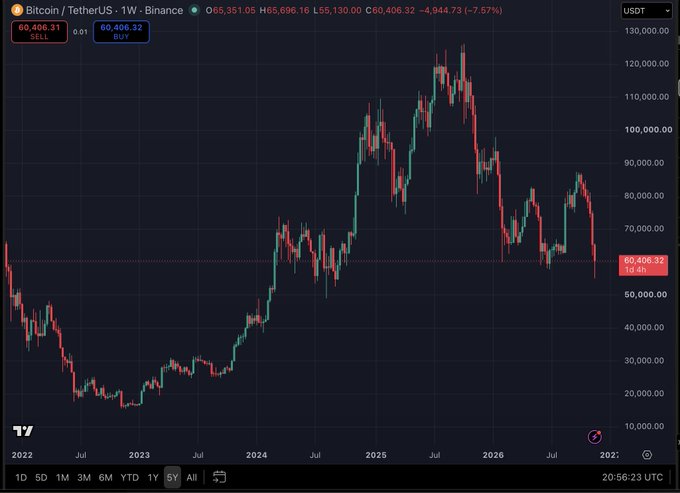
So does the bounce hold into Monday’s open, or does Hayes’ $50,000 test come first?
Hayes’ $50,000 Warning Hangs on the Nasdaq
His line is simple: “If Nasdaq keeps puking, $50,000 will be the next real test.” That makes Friday’s stock market the place to start, and Friday was ugly. Here are the closes:
- Nasdaq Composite: 22,617.73, down 5.28% on the day and 10.0% on the week.
- Nasdaq-100: 25,028.98, down 5.61%.
- Nvidia: $125.53, down 14%, after reports of an SEC review of its accounting.
Bitcoin’s first leg down lined up with that sell-off. Its last one didn’t.
The $55,130 print came between 06:00 and 07:00 UTC on Saturday (1:00 to 2:00 a.m. in New York). Stocks don’t trade then. Their weekend stand-ins do: Hyperliquid lists perpetual futures on the Nasdaq-100 and on Nvidia through trade.xyz, and both were calm in that hour. The Nasdaq-100 perp traded between 25,042 and 25,367 in the four hours around the low. In other words, the final wick was crypto’s own leverage, not a fresh stock panic.
And the weekend tape isn’t “puking” at all so far.
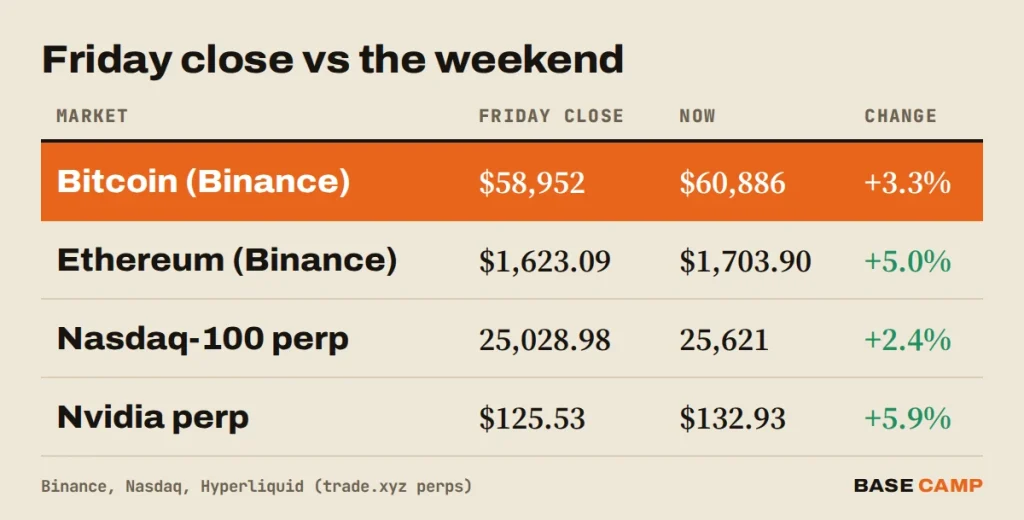
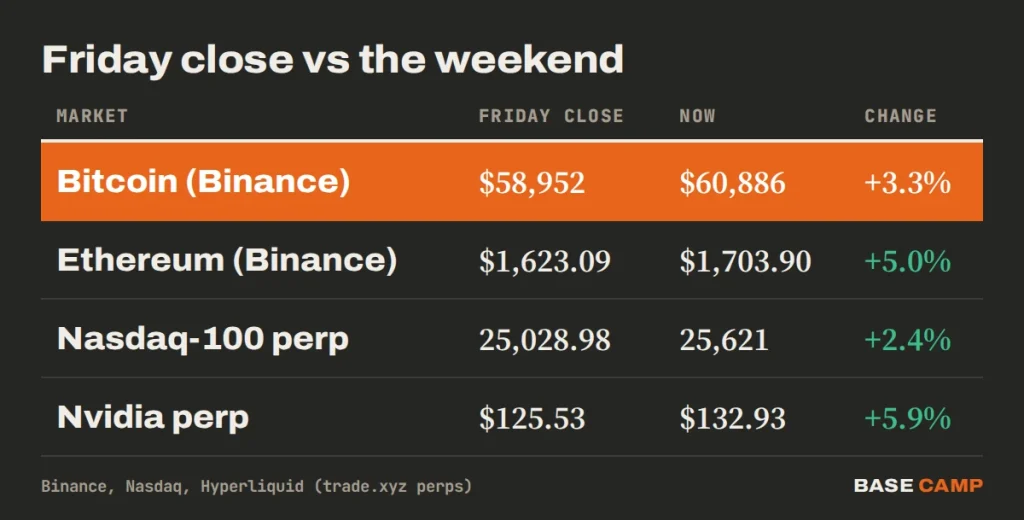
Hyperliquid’s Nasdaq-100 perp sits at 25,621, 2.4% above Friday’s cash close, and the Nvidia perp has bounced to $132.93. Those are thin weekend markets, and Monday’s open can ignore them. Still, they are the only live read on Hayes’ condition until then, and right now they back the Bitcoin price recovery.
For context, Arthur Hayes on Bitcoin usually means big upside targets built on central-bank money printing, so a $50,000 warning from him lands differently than it would from a permanent bear. The catch is in his own wording: it is a condition. No Nasdaq puke, no test.
Sponsored · Affiliate link
Save 20% on fees trading on WEEX
Base Camp may earn a commission if you sign up. It never affects what we write.
Who Fueled the Bitcoin Price Recovery?
Traders who turned short at the bottom. On Binance, 3.48 accounts were long Bitcoin for every one short at the start of Saturday. By the start of Sunday that had dropped to 2.19, according to Binance’s futures data. That is the lowest reading since November 5.
Longs didn’t just switch sides. They left.
Open interest, the value of all open futures, fell from 96,082 BTC to 91,792 BTC on Binance’s Bitcoin perpetual over Saturday, a 4.5% drop while the price rose. That is what a flush looks like: forced and panicked sellers out, fresh shorts in near the lows, and those shorts become fuel once the price turns. Base Camp’s Bitcoin price crash report counted $993 million in BTC longs liquidated in the 24 hours before the low.
Since then, open interest has started to rebuild, to 93,956 BTC. The funding rate is 0.0021% per eight hours, barely positive. Nobody is paying up to be long yet.
The mood hasn’t caught up with the price either. Alternative.me’s Fear & Greed Index reads 11, extreme fear, a point lower than yesterday, even with BTC $5,756 above Saturday’s low.
SIDE TRAIL: Nvidia Stock Trades Through the Weekend on Hyperliquid After a 14% Crash on an SEC Accounting Probe
Bitcoin Price Analysis: Can BTC Hold $60,000 Into Monday?
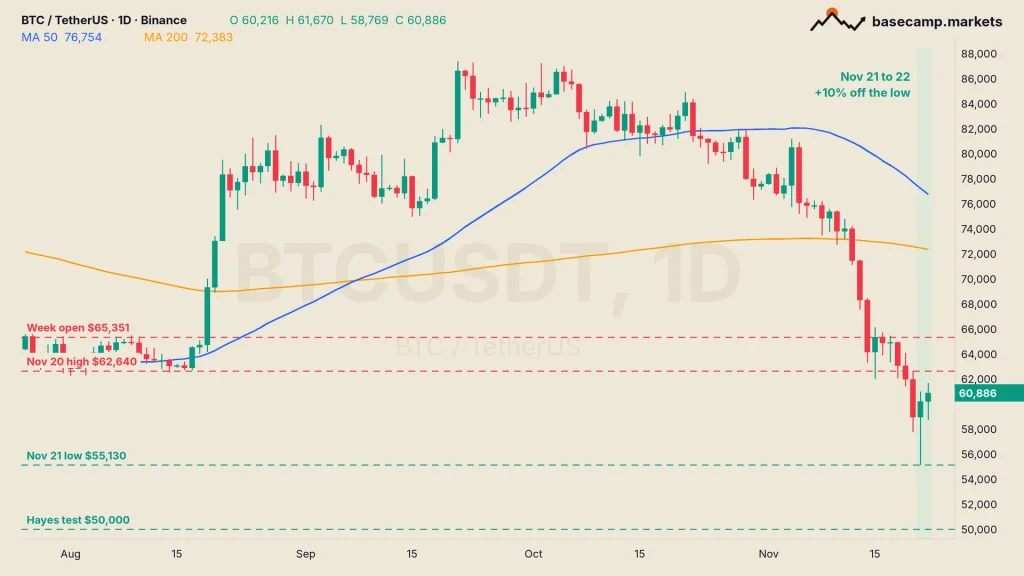
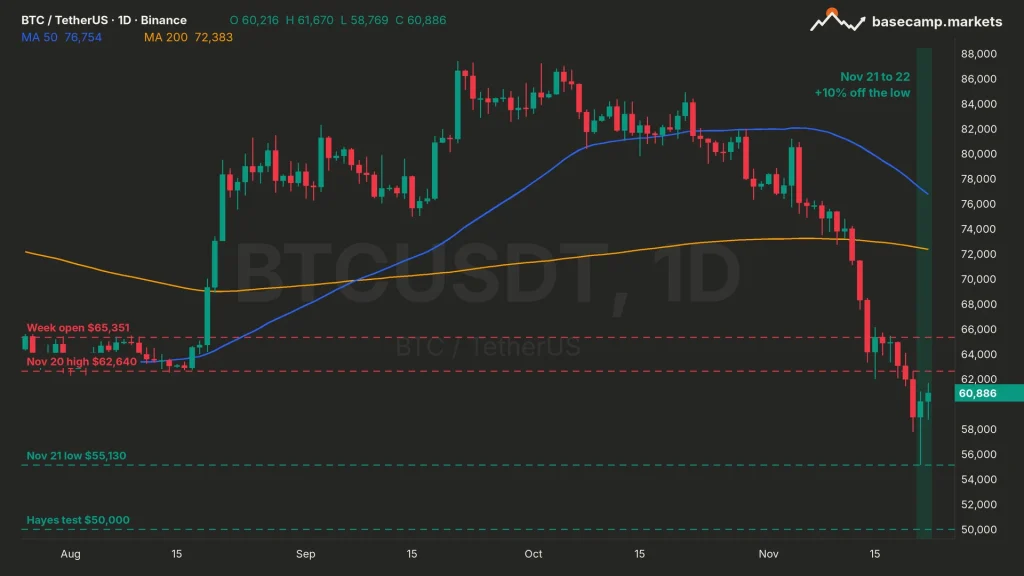
It can, but $60,000 isn’t much of a floor. BTC already dipped to $58,769 early on Sunday and bought back above $60,000 within hours.
The 50-day and 200-day moving averages, the average closes of the last 50 and 200 days, sit at $76,754 and $72,383. Both are far overhead, so this is still a bounce inside a downtrend. The levels that matter are much closer:
- First resistance: $61,670. Sunday’s high, reached on the second push into the $61,000s since the low.
- The real ceiling: $62,640. Friday’s high, where the second leg down started. Above it sit the $64,700 swing high and this week’s $65,351 open.
- First support: $58,769. Sunday’s low, then Friday’s $57,778.
- The floor: $55,130. Saturday’s low. A daily close under it opens the September 2024 low of $52,550.
Hayes’ $50,000 sits below all of that. Base Camp’s Bitcoin liquidation levels found the first big Hyperliquid whale long breaking at $51,862, so a slide toward his number would hit forced selling on the way.
The weekly chart looks settled. This week opened at $65,351, and BTC would need another 7.3% in a few hours to finish green. Anything less makes it the seventh red weekly candle in a row.
Ethereum has the same shape on its own chart. ETH bounced from $1,538 to $1,703.90 but sits far under its 50-day and 200-day averages at $2,248.19 and $2,123.80. The first swing high above is $1,833.40. Below, $1,512 is the last swing low on the daily chart, just under Saturday’s bottom.
This Bitcoin price analysis has one blind spot, and it is Monday. The US spot Bitcoin ETFs lost $582.3 million on Thursday, their worst day of November, and the weekend bounce happened without them.
TRAIL MAP: Risk Management and Position Sizing
The weekly candle closes at 00:00 UTC (7:00 p.m. Sunday in New York), an hour after Nasdaq futures reopen at 23:00 UTC. The cash market and the spot Bitcoin ETFs open at 14:30 UTC on Monday, 9:30 a.m. in New York.

Satoshi Flipper has more than 20 years of trading experience, starting in stocks before moving into crypto in 2017, and holds an MBA from the Kellogg School of Management. The edge is reading the economic data: rate decisions, inflation, jobs numbers, earnings and the US markets that move Bitcoin.
More from Satoshi Flipper