The short version
- Bitcoin weekly close: BTC ended Sunday at $78,354 on Binance, its fourth red week in a row and the lowest weekly close since September 13.
- Since 2017, only three of 11 four-week red streaks ran to a fifth week, but the two that kept sliding, in 2018 and 2022, lost another 23% to 43% within a month.
- Next: Sunday’s weekly close at 00:00 UTC (7:00 p.m. in New York), after the midterms and Friday’s jobs report, with the October low at $76,326 as the line. Follow Base Camp on X to see it first.
The Bitcoin weekly close price came in at $78,354 on Binance on Sunday, 2.2% down on the week and the fourth red weekly candle in a row. It is also the lowest weekly close since the week ending September 13, when BTC finished at $76,842.
The four Sundays read like a slow leak: $83,773, $82,116, $80,154 and now $78,354. Together that is 9.4% off the $86,530 close of October 4, without a single week that looked like a crash. BTC trades at $78,300 at the time of writing. So how often does a streak like this run to five, and what decides next Sunday?
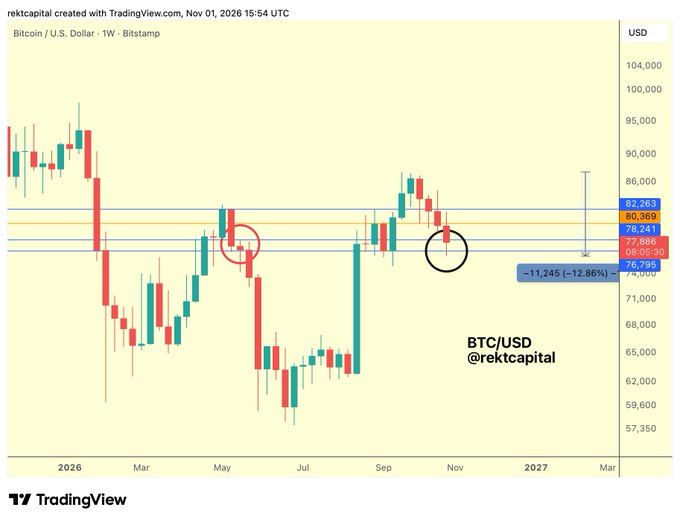
Rekt Capital marked the line a few hours before the candle closed:

#BTC
Bitcoin is mere hours away from the upcoming new Weekly Close and price is still below the Weekly level of ~$78200
A Weekly Close below ~$78200 could position Bitcoin for yet another bearish retest, akin to May 2026 (red circle)
$BTC #Bitcoin
How Did the Bitcoin Weekly Close Turn Red Again?
In one night. The week was green until Thursday evening: BTC closed Wednesday at $81,344 after the Fed held rates, and touched $81,971 on Thursday. Then Binance wallets began draining at 20:05 UTC, per TRM Labs, and Bitcoin ended the day at $77,992, down 4.1%.
Friday did the rest. BTC dipped to $76,326, the October low, while US spot Bitcoin ETFs lost $643.2 million, their biggest day of outflows since June. The weekend was a slow climb back: October closed at $77,582 on Saturday, and Sunday added 1%.
That last 1% mattered. Rekt Capital’s weekly level sat near $78,200, and the close cleared it by about $150. Holding a line by that little isn’t a retest won, though. The candle still closed red, with a long lower wick that shows buyers only stepped in once price reached the October low.
Sponsored · Affiliate link
Save 20% on fees trading on WEEX
Base Camp may earn a commission if you sign up. It never affects what we write.
How Often Does a Fifth Red Week Follow?
Not often. Since Binance’s BTC/USDT chart starts in August 2017, Bitcoin has strung together four red weeks 11 times before this one. Only three ran to a fifth.
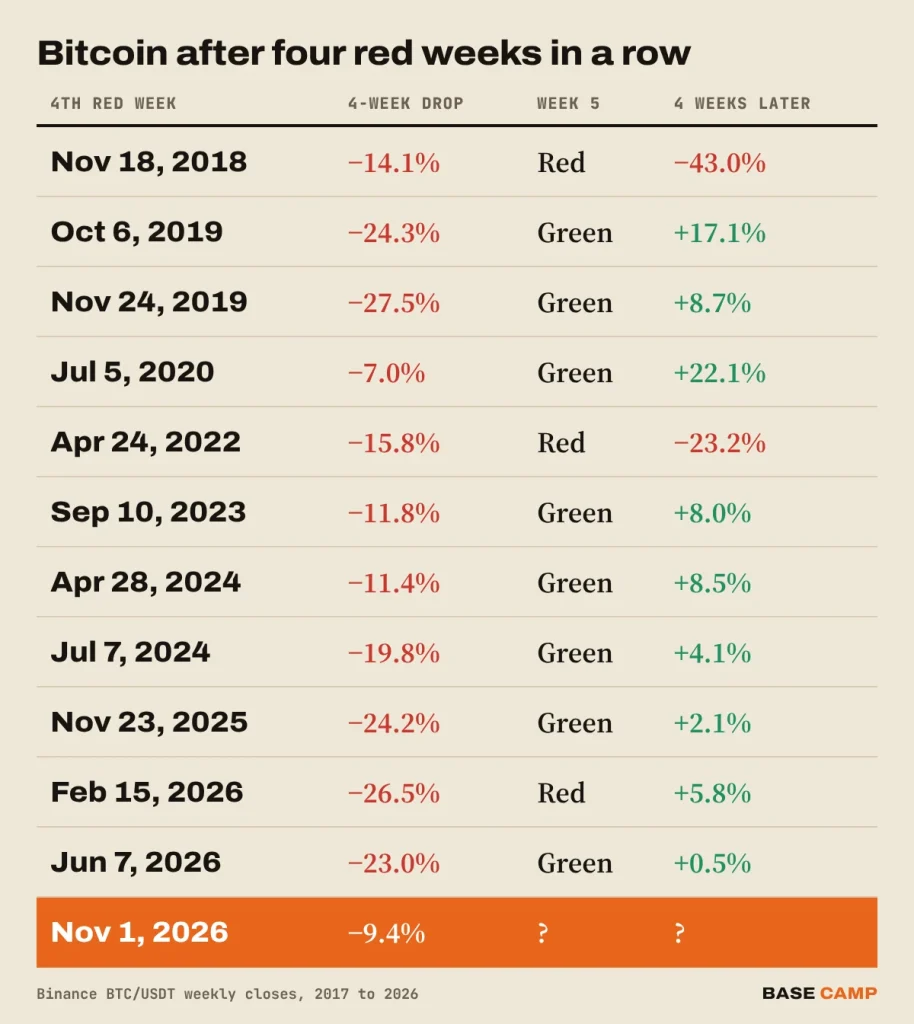
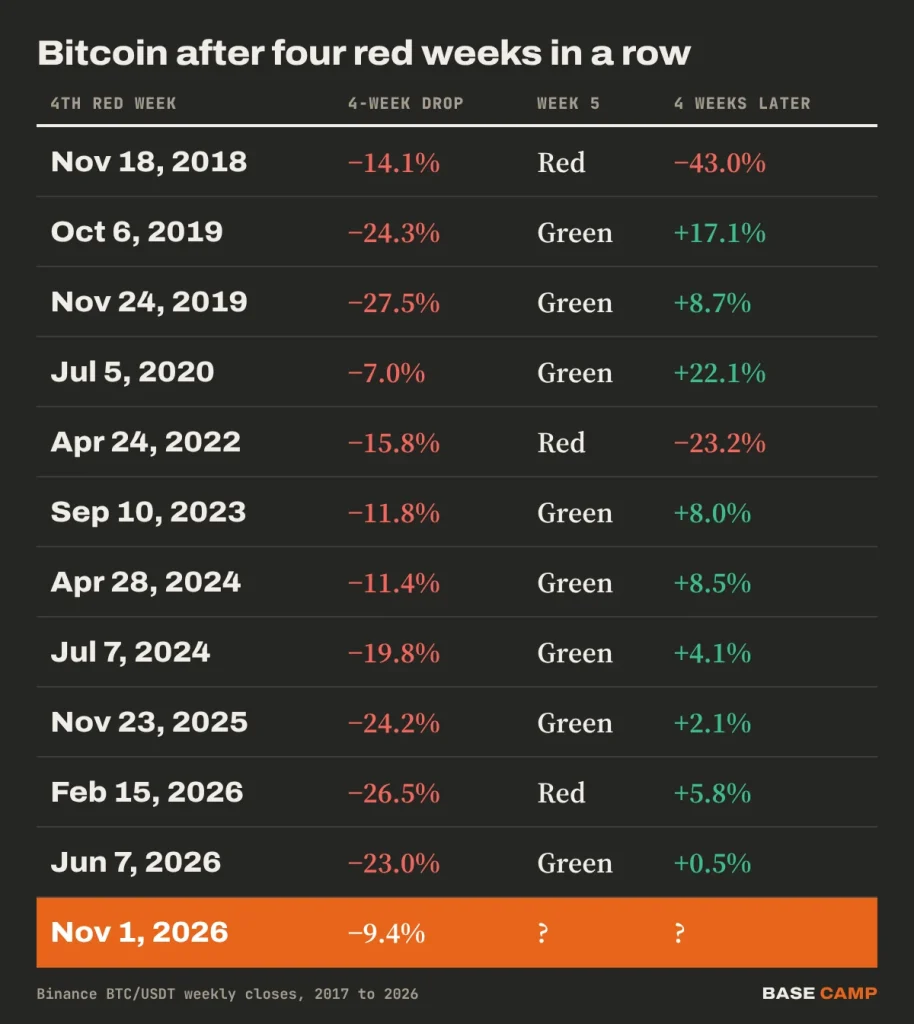
Four weeks after the fourth red close, BTC was higher nine times out of 11. The two exceptions were the ugly ones: November 2018, when Bitcoin fell another 43% in a month, and April 2022, a streak that ran nine weeks into the Terra collapse. Even the good cases rarely went straight up. In seven of the nine, BTC traded at least 3% below the fourth close at some point in the following month.
Two more things stand out. This streak is the mildest in the table since 2020: its 9.4% drop is less than half of what the 2025 and 2026 streaks cost. And it is already the third streak of four or more red weeks this year, after six in a row from late January and four from May into June.
SIDE TRAIL: Bitcoin Weekly Close at $80,154 Is the Lowest Since September
Bitcoin Price Analysis: What Decides the Next Weekly Close?
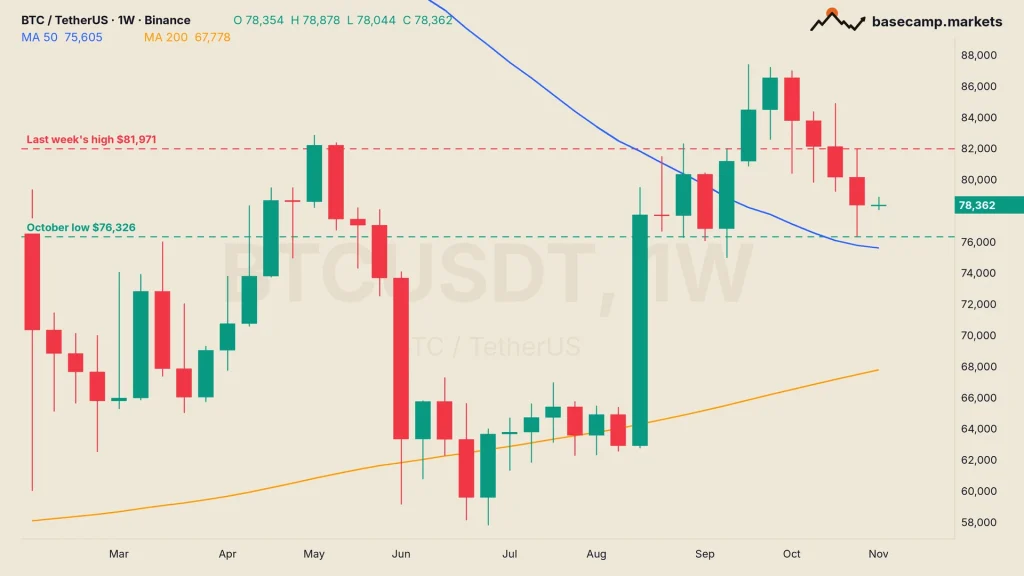
On the Bitcoin weekly chart, the October low does. BTC has held $76,326 on every weekly close since mid-September, and just under it sits the 50-week moving average at $75,605, the line Bitcoin reclaimed in September. The 200-week average is far lower, at $67,778.
The week has plenty to move it. The US midterm elections are on Tuesday, with the first polls closing at 23:00 UTC (6:00 p.m. in New York), and Binance’s full proof of reserves is due the same day. The jobs report follows on Friday at 13:30 UTC (8:30 a.m. in New York). The candle closes at 00:00 UTC on Monday, which is 7:00 p.m. on Sunday in New York.
A weekly close back above $80,154, last week’s open, would end the streak. A close under the October low would put $74,968, the September low, next in line.
TRAIL MAP: How to Read a Candlestick Chart: Bodies, Wicks and the Patterns Worth Knowing
Four red weeks in a row is a warning, not a verdict. History says a fifth is the exception, and Sunday’s Bitcoin weekly close will show whether this one is.

Satoshi Flipper has more than 20 years of trading experience, starting in stocks before moving into crypto in 2017, and holds an MBA from the Kellogg School of Management. The edge is reading the economic data: rate decisions, inflation, jobs numbers, earnings and the US markets that move Bitcoin.
More from Satoshi Flipper