The short version
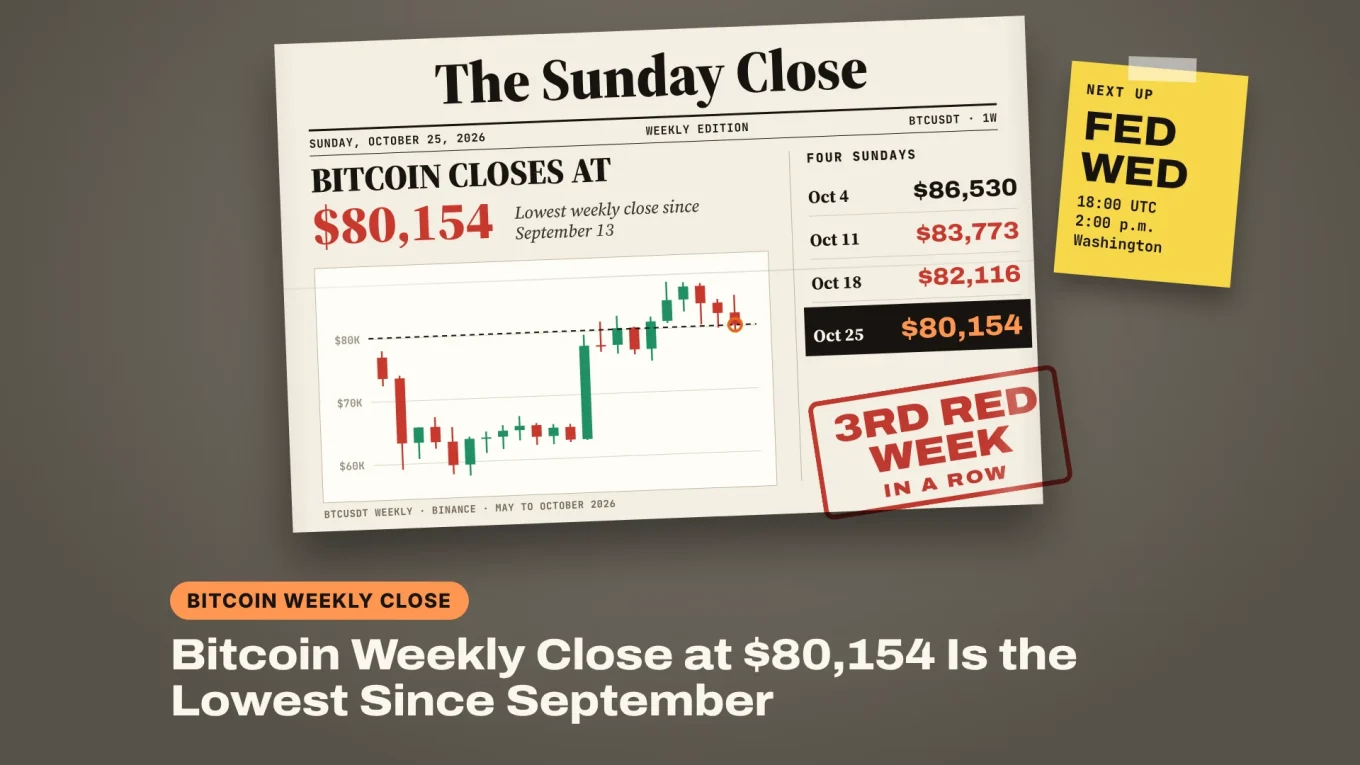
- Bitcoin weekly close: BTC ended Sunday at $80,154 on Binance, its third red week in a row and the lowest weekly close since September 13.
- The close landed below the roughly $81,000 average cost of ETF buyers that Glassnode flagged, even though US spot Bitcoin ETFs took in $301.2 million last week.
- The crew is watching the 50-week EMA near $78,600 below and a weekly close back above $81,000, with the Fed deciding on Wednesday at 18:00 UTC (2:00 p.m. in Washington).
Sunday’s Bitcoin weekly close looked like a staircase going one way. BTC finished the week at $80,154 on Binance, its third red week in a row and its lowest weekly close since September 13, when it closed at $76,842.
Each Sunday has been a step lower: $86,530, then $83,773, $82,116 and now $80,154. That’s 7.4% off the early October peak in three weeks, and it happened in a week when US spot Bitcoin ETFs took in money. BTC trades at $79,630 at the time of writing. So what does the weekly chart say with the Fed decision three days away?
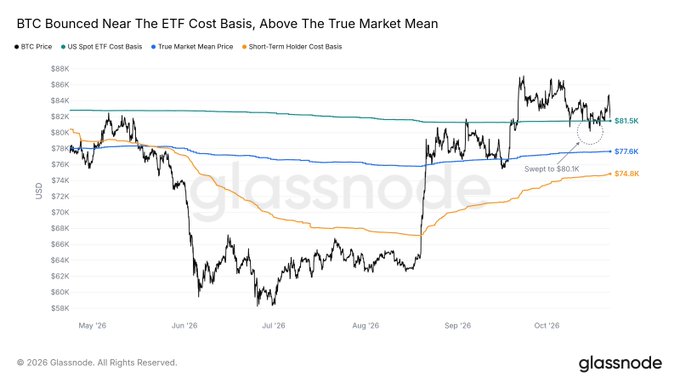
Glassnode drew the line on Thursday, before the week was done:

bitcoin:native is testing the ETF cost basis around $81K again.
The same level capped the May rally before a deep drop, and caught last week's sweep from just below.
A convincing close below it would put mid $70K levels back into play.
How Low Was Sunday’s Bitcoin Weekly Close?
Low enough to break a level that has held since mid-September. The weekly candle closes at midnight UTC on Sunday, which is 8:00 p.m. in New York, and here is how the last four ended on Binance:
| Week ending | Weekly close | High of the week | Change |
|---|---|---|---|
| October 4 | $86,530 | $87,220 | +2.4% |
| October 11 | $83,773 | $86,999 | −3.2% |
| October 18 | $82,116 | $84,352 | −2.0% |
| October 25 | $80,154 | $84,898 | −2.4% |
The highs tell the same story as the closes. Bitcoin reached $87,396 in September and hasn’t been back since. Each week now tops out lower and closes lower, the pattern traders call market structure turning down.
Last week’s candle hurt the most. It reached $84,898 on Wednesday, then gave back almost all of it and left a long upper wick, the line that shows where price went but couldn’t stay.
Sponsored · Affiliate link
Save 20% on fees trading on WEEX
Base Camp may earn a commission if you sign up. It never affects what we write.
Why Did Bitcoin Close Lower Despite ETF Inflows?
Because the selling came from stocks and leverage, not from the funds. US spot Bitcoin ETFs took in a net $301.2 million from October 19 to 23, ending a two-week run of outflows, as we covered in our ETF flows recap. The money just arrived early in the week, and the price fell late.
Two days did the damage:
- Thursday: the Nasdaq Composite fell 2.6%, its worst day since June, and Bitcoin slid with it from $84,898 to under $81,000. Crypto still trades like a chip stock, and we measured how much in our piece on the Bitcoin Nasdaq correlation.
- Saturday: BTC dipped to $79,221, under the October 15 low, and about $402 million in longs got liquidated in four hours. Price bounced back above $80,000, but not far.
Oil didn’t help either. CryptoQuant pointed out on Friday that Brent is holding above $100, and that Bitcoin has often slowed down when oil trends above its yearly average.
What Does the Bitcoin Weekly Chart Say?
It says the bulls lost one floor and are standing on the next. Glassnode puts the ETF buyers’ average cost near $81,000 and called it the line to watch: a convincing close below it would put the mid-$70,000s back in play. Sunday’s close was below it.
The next floor sits right underneath. Bitcoin treasury companies hold their coins at a cost of about $80,000, according to Glassnode, and BTC has closed above that level every day since September 18. The weekly close held it by $154. Today’s price doesn’t.
Under that comes the 50-week EMA, the average that weights recent weeks more, at about $78,600. Bitcoin climbed back above it in August, and the weekly closes stayed above it through the September dip. The weekly chart is still in an uptrend from the summer low of $57,800, but every lower close makes that harder to argue.
DISCOVER: Market Structure: Reading Trends Through Highs and Lows
Bitcoin Price Analysis: Can BTC Hold $78,600 Into the Fed?
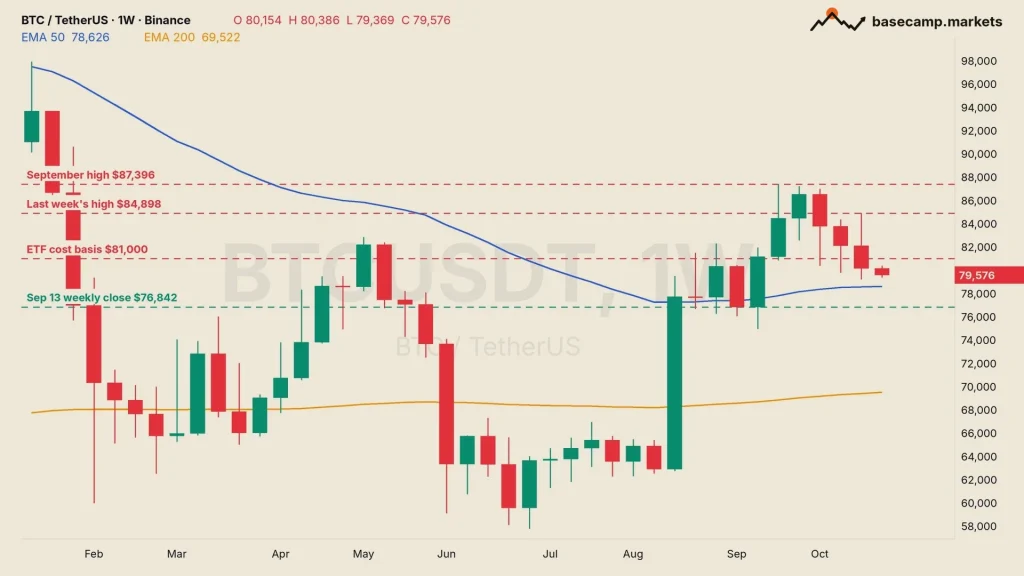
It can, but the Fed decides how easily. The Federal Reserve announces its decision on Wednesday at 18:00 UTC, which is 2:00 p.m. in Washington, and Kalshi traders price a 94% chance of a hold. December is the real worry: they put a hike at 75%, and a hawkish hold could push that higher. We laid out what each outcome would mean in our Fed decision preview.
The levels the crew is watching on the weekly chart:
- Bull case: a weekly close back above $81,000 puts BTC on the ETF cost basis again and makes last week look like a shakeout. Then $84,898, last week’s high, is the level to clear.
- Base case: a week between $78,600 and $81,000 while the market waits for the Fed, Thursday’s inflation data and Saturday’s monthly close.
- Bear case: a weekly close under the 50-week EMA at $78,600 opens the way to $76,842, the September 13 close, and the $74,968 low from the week after.
EXPLORE: Multi-Timeframe Analysis: Top-Down Trading From the Weekly to the Entry
October opened at $83,624, so Bitcoin needs to be back above that by Saturday night to save the month. Next Sunday’s Bitcoin weekly close is the one that matters more: a fourth lower step would put the mid-$70,000s on the table.

In crypto since 2016. Trades the macro picture and reads the market on the high timeframes.
More from TheCryptoMonk →