The short version
- ZEC price fell 13% in 24 hours and hit $966.06 on Binance, its lowest since September 4, before bouncing back to about $1,000.
- It came in two legs: a 17% drop on Tuesday afternoon and an overnight slide in which OKX alone liquidated more than $1 million of ZEC longs.
- Next: whether $933, the September 4 low, holds into the weekly close at 00:00 UTC on Monday, November 16.
$966. That is where Zcash bottomed on Binance this morning, its lowest price since September 4.
The ZEC price is back at about $1,000 at the time of writing, down 13% in 24 hours and 22% on the week. Market value: $17 billion. Daily volume: $1.37 billion, a lot for a coin going nowhere good.
There was no hack and no bad headline. Just leverage leaving the building, two days in a row.
So where does it stop?
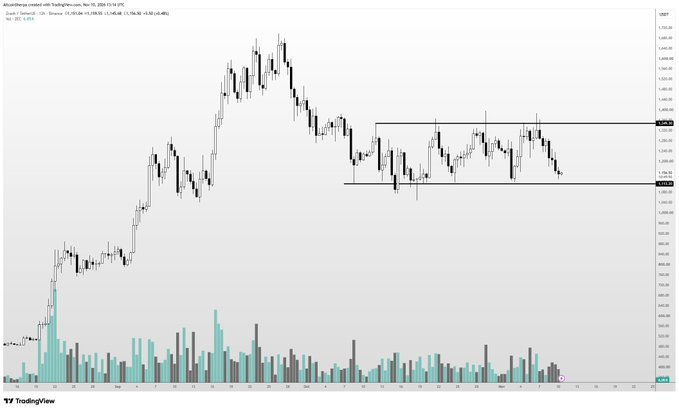
Trader AltcoinSherpa called the level on Tuesday, two hours before it broke: lose $1,100, and sub-$1,000 becomes the bid.

$ZEC I feel should bounce soon at this range low; its held for weeks on end here. But I'll admit things look a bit heavy and it's not going to tremendously surprise me if we lose that 1100 level. If it does, this becomes an excellent bid sub 1000 imo. Still think it should find
How Hard Were ZEC Longs Hit?
Hard, and twice.
The first leg came on Tuesday between 15:00 and 17:00 UTC (10:00 a.m. to noon in New York). ZEC fell from $1,199.82 to $994.22 on Binance in two hours, a 17% drop. Those two hours traded $90 million on Binance spot, more than a third of the day’s volume.
The bounce stalled near $1,050. Tuesday closed at $1,044.95, the lowest daily close since September 5.
The second leg hit overnight. Between 06:00 and 07:00 UTC, ZEC slid from $1,017.65 to $982.57 on the heaviest hourly volume of the night, then wicked to $966.06.
On the OKX liquidation feed alone, more than $1 million of ZEC longs were force-closed between 05:30 and 07:25 UTC. A liquidation is the exchange selling a trader’s position because the margin behind it ran out. Every one of those sales pushed the price lower and tripped the next one.
Then the liquidations flipped sides. When ZEC bounced back above $1,000 just before 08:00 UTC, it was the shorts on OKX getting squeezed, in a cluster between $996 and $1,003.
One more thing. Binance futures open interest, the number of open contracts, rose from about 435,500 ZEC at midnight UTC to about 472,800 ZEC by 08:00 UTC. Traders are not leaving. They are opening new bets into the drop.
Sponsored · Affiliate link
Save 20% on fees trading on WEEX
Base Camp may earn a commission if you sign up. It never affects what we write.
Five Days After NU7
NU7 itself works. The upgrade went live at block 3,543,405 on November 6, and the chain has produced about 17,900 blocks since, close to the new 25-second pace.
The ZEC price is another story. It closed November 6 at $1,323.01. It has lost 24% since.
Part of it is the market. Bitcoin is at $73,945, down 1.1% in 24 hours, and the Crypto Fear & Greed Index sits at 29, in fear. But a 1% Bitcoin dip does not explain a 13% Zcash day.
What does is crowding. ZEC was one of the strongest large caps of the autumn, and a lot of traders were long it with leverage. When that kind of trade turns, it turns fast.
SIDE TRAIL: Zcash Price Climbs Back to $1,250 With NU7 Ten Days Away
ZEC Price Analysis: Where Is Support Below $1,000?
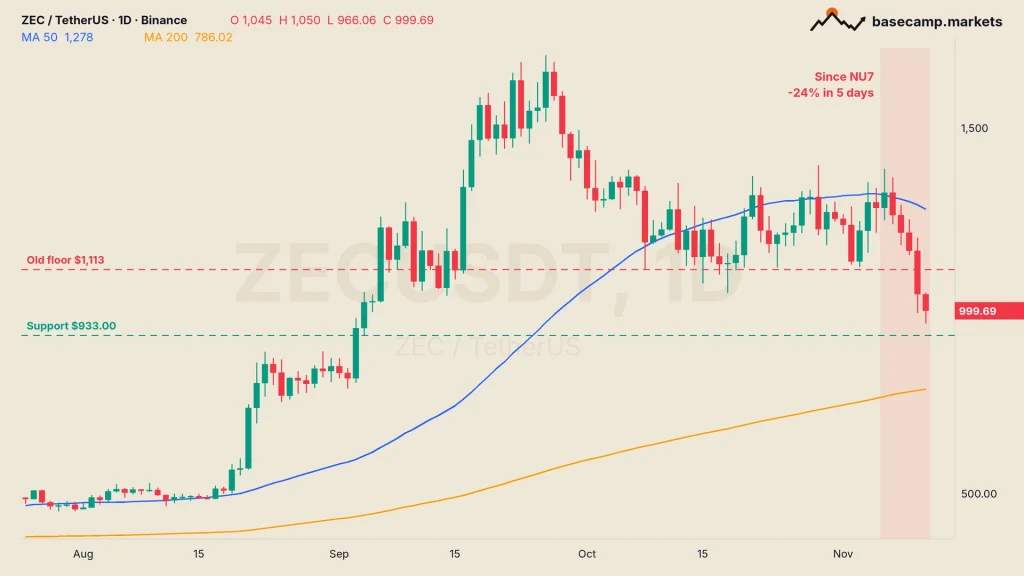
For the ZEC price, the nearest real support sits at $933, the September 4 low. Above it, $974 marks the halfway point of the move from June’s $250 low to September’s $1,698 top, and this morning’s wick stopped just under it.
The bigger picture matters more here. The 200-day moving average (MA), which smooths out the last 200 daily closes, is down at $786. The 50-day MA is at $1,278. ZEC now sits between the two, and the trend line traders watch most is a long way overhead.
- Resistance: $1,113. The October 8 low, which held as a floor for a month and broke on Tuesday.
- First support: $933. The September 4 low, where the September breakout started.
- Deeper support: $786. The 200-day MA, still rising.
A weekly close under $1,000 would be the first since the start of September. The weekly candle closes at 00:00 UTC on Monday, November 16.
TRAIL MAP: Futures and Leverage Explained: Perps, Margin and How Liquidation Really Works

TheCryptoMonk has been trading since 2017 and reads the market from the top down. The focus is macro and the high timeframes: where stocks, rates and liquidity are heading, and what the weekly and monthly charts say about Bitcoin. Short-term noise matters less than the bigger trend.
More from TheCryptoMonk