The short version
- Bitcoin October 2026 is down 7.5% at $77,316 against the $83,624 open, on course for the first back-to-back red October since records start in 2013.
- A hawkish Fed, the $6.3 billion Binance hack and a 26% drop in Intel shares hit in three days, and Polymarket gives a close above $82,000 under 1%.
- The crew is watching $80,000 and $76,000 into the monthly close at 00:00 UTC on Sunday (8:00 p.m. ET Saturday), with the September low at $74,968 below.
Bitcoin October 2026 is on track to finish where October 2025 did: in the red. BTC opened the month at $83,624 on Binance and trades at $77,316 at the time of writing, down 7.5% with a day and a half left.
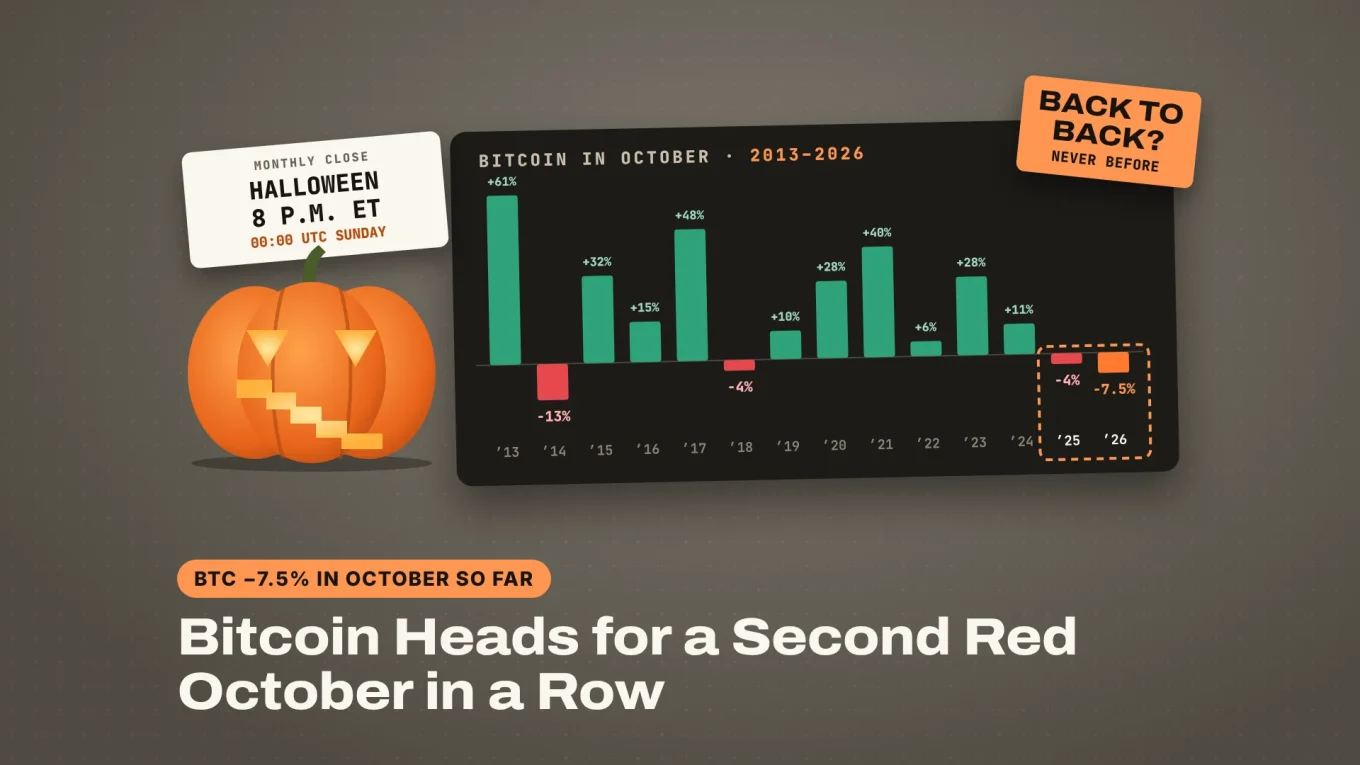
That would be a first. In 13 Octobers since 2013, Bitcoin never closed two in a row lower. “Uptober” was supposed to be the easy month. Instead the biggest crypto hack on record, a hawkish Fed and a chip-stock crash all landed in the same week. So how much would it take to save the month, and where does BTC go into Saturday’s close?
The slide that sent Bitcoin to a one-month low started with this update from Binance:

Binance's initial investigation suggests that the security incident may involve a compromised DevOps engineer’s laptop, which allowed an attacker to gain access to a service container and submit unauthorized withdrawal transactions. We have found no evidence of any wallet private

How Bad Is Bitcoin October 2026 So Far?
Bad enough to be the worst October since 2014. BTC is 7.5% below its October open, deeper than the 3.9% loss in October 2025 and the 3.8% loss in 2018. Only 2014 was worse, at −13.2%.
The month started well. Bitcoin hit $87,220 on October 2 and closed the first week at $86,530. It has not traded that high since. Three red weeks followed, and on Thursday night $80,000 finally gave way after holding on every daily close this month. The low so far is $76,500 on Binance, set in the early hours of Friday. Kraken printed $76,330.
The year doesn’t look much better. Bitcoin opened 2026 at $87,648, so a close at today’s price would leave it 11.8% down for the year, with five red months out of ten.
Sponsored · Affiliate link
Save 20% on fees trading on WEEX
Base Camp may earn a commission if you sign up. It never affects what we write.
Has Bitcoin Ever Had Two Red Octobers in a Row?
No. Bitcoin October history has only three red months since 2013, in 2014, 2018 and 2025, and never two years running. The other ten Octobers were green, and the middle result of all 13 was a 14.6% gain.
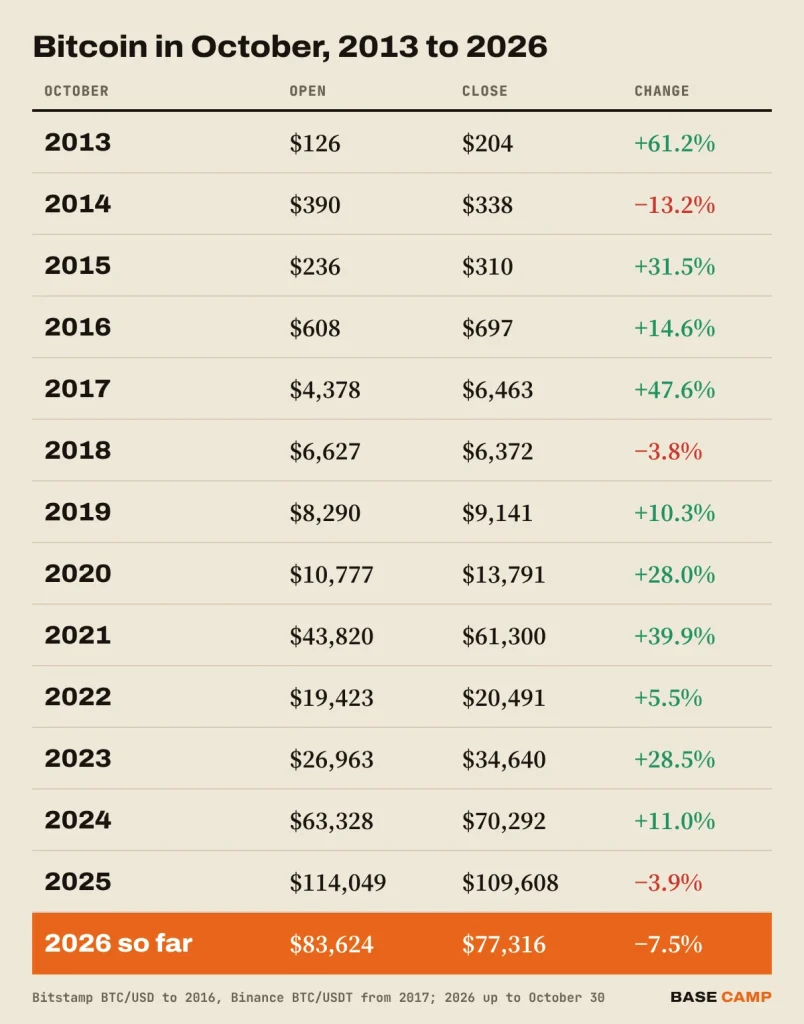
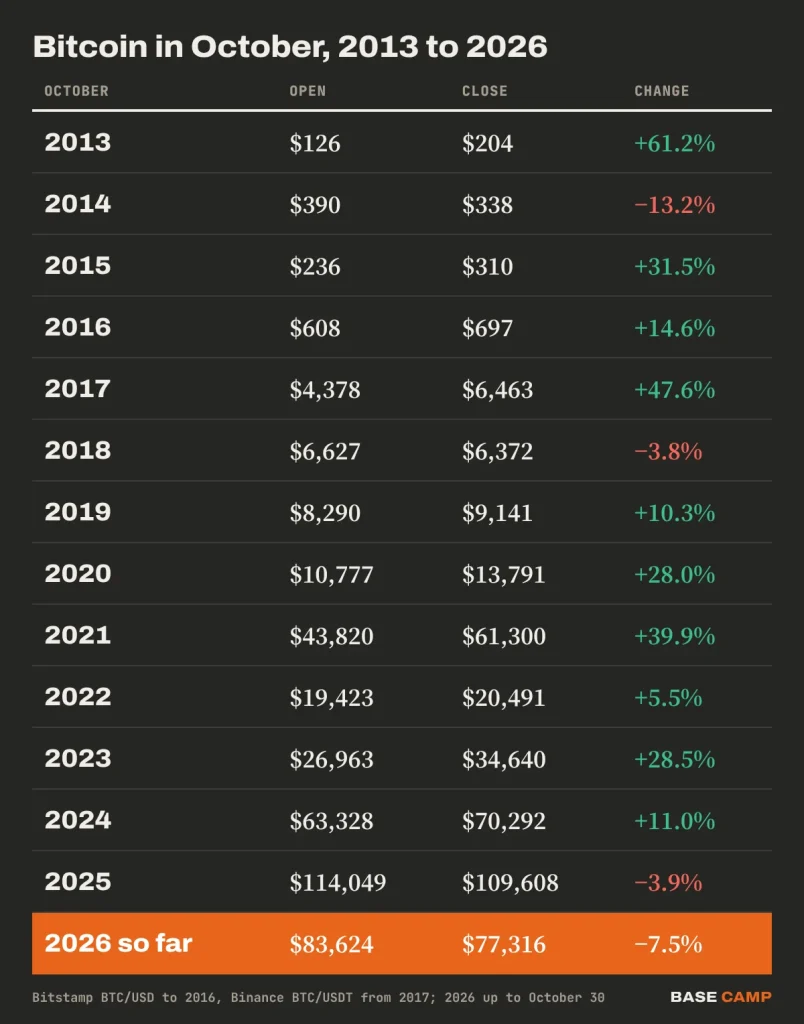
So the “Uptober” reputation is earned, just not this year. Seasonality is a record of what happened, not a promise. October 2025 broke a six-year green streak, and October 2026 is about to make it two.
What came after the red ones is mixed. November 2014 gained 11.5%. November 2018 lost 36.6%, the month Bitcoin fell from $6,370 to $4,040. November 2025 lost 17.6%. Three cases are far too few to call a pattern, but two of them got worse before they got better.
SIDE TRAIL: How to Read a Candlestick Chart: Bodies, Wicks and the Patterns Worth Knowing
What Sank Bitcoin This Week?
Three hits in three days, and the last one was the hardest.
The Fed on Wednesday. The Federal Reserve held rates at 3.75% to 4.00%, but two members voted for a hike and Kevin Warsh said inflation is too high. Kalshi now prices a hike on December 9 at 83%, as our Fed decision story laid out. Bitcoin held up that evening and bounced to $81,971 on Thursday afternoon.
The Binance hack on Thursday night. The theft began at 20:05 UTC, and Bitcoin fell from $80,849 to $78,297 within that hour on Binance. The exchange puts the damage at about $6.3 billion, the biggest crypto hack ever, and paused withdrawals. It says it will cover every loss and expects withdrawals back early Sunday, a few hours after the monthly close.
Stocks on Friday. Intel shares trade about 26% lower before the bell after its third-quarter results on Thursday, at $68.26 against Thursday’s $92.07 close. Nasdaq 100 futures are down 2.6%. Oil isn’t helping either: US crude is at $103.78 and Brent at $112.86.
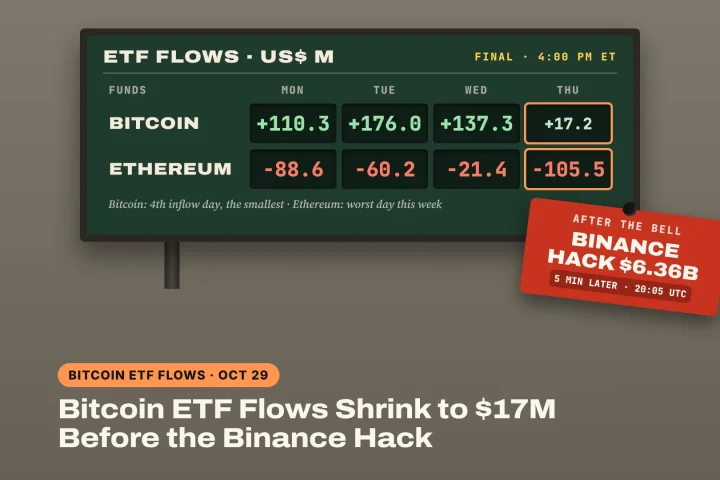
Spot Bitcoin ETFs offer no cushion yet. They took in a net $17.2 million on Thursday, per Farside, but that day closed five minutes before the hack began. Friday’s flows will be the first to show a reaction. The Fear & Greed Index dropped from 51 to 30 in a day.
What Prediction Markets Say About the October Close
Traders have already cashed one bet on a lower October. Kalshi’s “Below $77,500” market settled yes early on Friday, four days after it traded at 45% in our look at the October low odds.
The next lines are further away, and the odds say so:
- Below $75,000 in October: 24% on Kalshi and 21.5% on Polymarket.
- Below $72,500: 4% to 6% on Kalshi, 4.5% on Polymarket.
- Below $70,000: about 1%.
A separate Polymarket market asks where Bitcoin will trade at noon ET on Saturday, eight hours before the close. Traders give 79% to above $76,000, 34% to above $78,000 and 5.5% to above $80,000. Above $82,000 trades at under 1%. In other words, the market has close to no doubt that October ends red.
One detail matters for anyone trading these. Both markets run until 11:59 p.m. ET on October 31, so they count the four hours after the UTC monthly close too. A prediction market only pays on its own rules, and here the rules are wider than the candle.
TRAIL MAP: Bitcoin Cycles and the Halving: What Four Cycles of Data Actually Show
Bitcoin Price Analysis: Can BTC Save October Before the Close?
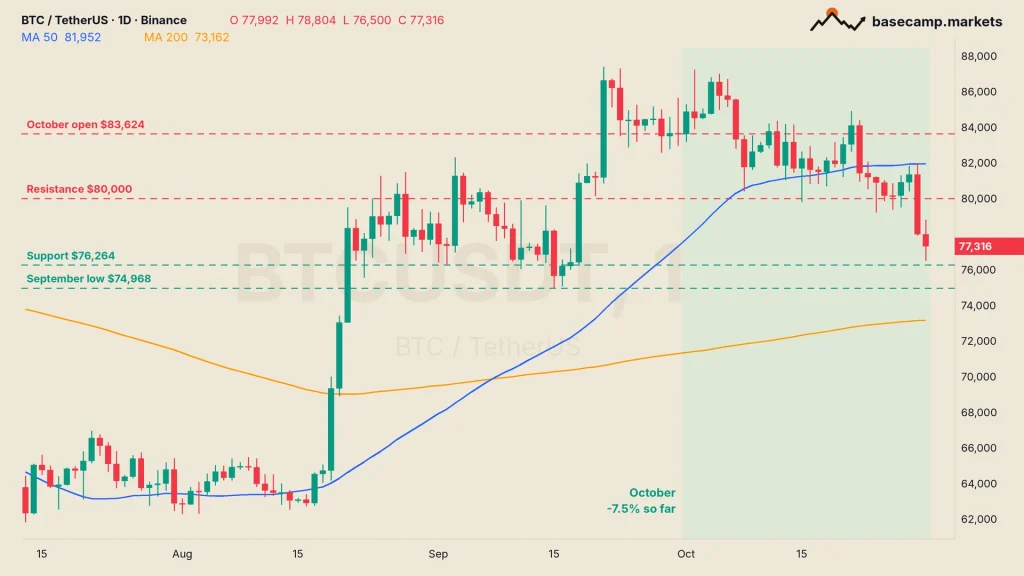
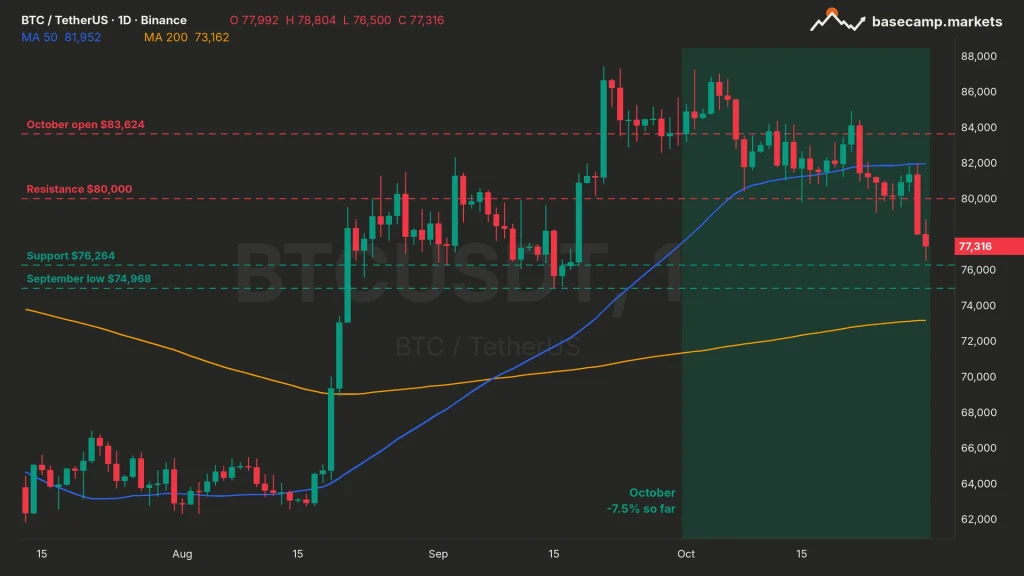
Not realistically. A green October needs a Bitcoin monthly close above $83,624, 8.1% above the price, by 00:00 UTC on Sunday (8:00 p.m. ET on Saturday). Bitcoin hasn’t closed a day there since October 21.
The levels into the close are close together. The 50-day moving average sits at $81,952, and BTC has traded under it since October 22. $80,000 is the first ceiling: the round number that held every daily close this month until Thursday. Below the price, $76,264 is the next swing low, with the 0.382 Fibonacci retracement of the summer rally right under it at $76,090. Then comes the September low at $74,968, and the 200-day moving average at $73,162.
- Bull case: Bitcoin reclaims $80,000 before Saturday evening and closes October around 4% down, a better candle than it looks today. The next test is the 50-day average near $82,000.
- Base case: BTC chops between $76,000 and $80,000 through a thin weekend and closes the month 4% to 9% lower, the worst October since 2014.
- Bear case: a daily close under $76,000 opens the September low at $74,968, and the $75,000 bets on Kalshi and Polymarket pay out. A close that low would make it a double-digit red October for only the second time, after 2014.
A monthly candle only cares where it ends. For Bitcoin this year, that end is Halloween night.

In crypto since 2017. A technical trader with years of experience in DeFi and onchain data.
More from TANG →