The short version
- Bitcoin daily close on Monday, November 2, came in at $76,816 on Binance, down 2.0% and the lowest close since September 17, after a slow slide through the US session.
- The last close this low turned into a 14% rally in four days, but this time the 50-day average is flat above the price and five floors sit between $76,326 and $73,205.
- Next: the midterm results tonight and Friday’s jobs report at 13:30 UTC, with $76,326 the line to hold. Follow Base Camp on X to see each one first.
The Bitcoin daily close on Monday was the weakest in seven weeks. BTC finished November 2 at $76,816 on Binance, down 2.0% on the day and its lowest close since September 17, when it ended at $76,417.
Nothing broke on Monday. There was no hack, no liquidation wave and no single headline, just a slow slide through the US session that took Bitcoin to $76,705 and left it there. That makes the next few days more interesting than the close itself. The last time Bitcoin closed this low, it rallied 14% in four days. Can it do that again, and which levels decide it?
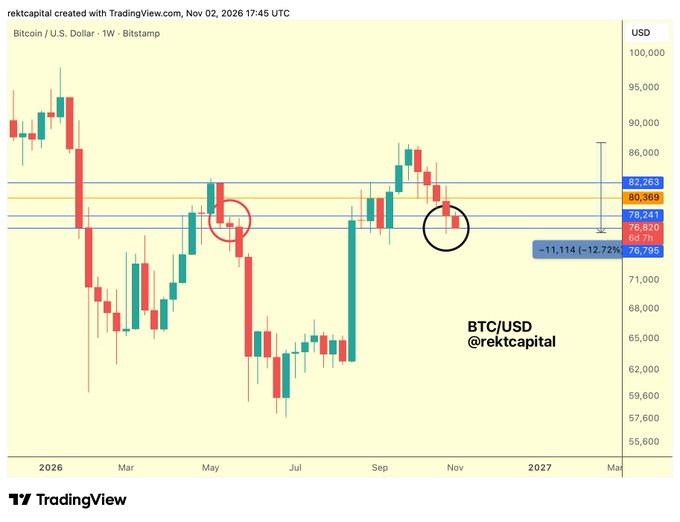
Rekt Capital flagged the same spot on Monday evening, $76,800, with a test for the bounce that we come back to below:

#BTC
Let's see how Bitcoin reacts from ~$76800
After all – "any lesser rally than the mid-September uptrend originating from this local ~$76800 support would be a sign of weakening support"
If Bitcoin produces a weak bounce but rejects from ~$78300 then that's a weakening
Why Was the Bitcoin Daily Close So Low on Monday?
Mostly a weak US session in a market that was already tired. Bitcoin held above $77,600 through Asia and Europe, then slid from about $77,900 to $76,705 between 15:00 and 20:00 UTC (10:00 a.m. to 3:00 p.m. in New York), while the S&P 500 slipped 0.5% after a 1.8% drop on Friday.
The tiredness has a history. Bitcoin fell from $81,344 to $77,992 on October 29, the day the $6.3 billion Binance hack broke, and touched $76,326 the next day. US spot Bitcoin ETFs then lost $643.2 million on Friday, October 30, their biggest one-day outflow since June, and closed October $515.9 million in the red.
The weekend bounce peaked at $78,878 early on Monday and never got going. By the close, Monday had taken it all back and a bit more. The Fear & Greed Index dropped from 37 to 26 overnight, back in Fear.
Sponsored · Affiliate link
Save 20% on fees trading on WEEX
Base Camp may earn a commission if you sign up. It never affects what we write.
What Happened the Last Time Bitcoin Closed This Low?
It squeezed higher, fast. On September 17, Bitcoin closed at $76,417, the day after the Fed raised rates by a quarter point. Two days earlier it had wicked to $74,968. Then it turned: $80,884 on September 18 and a high of $87,396 on September 21, about 14% above that close in four days.
That bounce is the yardstick traders are using now. Rekt Capital’s point on Monday was simple: a rally from $76,800 that is weaker than the September one would show the support is wearing out, and a rejection near $78,300 would be the first sign. Bitcoin went on to $76,542 early on Tuesday and trades at $77,050 at the time of writing, so that test is live.
There is one big difference from September. Back then, Bitcoin was coming up from $62,535, its mid-August low, and the 50-day moving average was rising steeply under it. Now it is coming down from $87,220, the October 2 high, and the 50-day average has gone flat at $81,959, above the price.
SIDE TRAIL: Bitcoin November 2026: What History Says After a Second Red October
Are Traders Panicking Below $77,000?
Not yet, and that cuts both ways. Bitcoin’s funding rate on OKX is still at 0.01% per eight hours, the standard rate, which means traders holding long futures are paying the usual small fee to stay in. Hyperliquid shows the same. Open interest on OKX slipped only from $3.75 billion to $3.63 billion on Monday.
In plain words, Monday’s drop did not flush out leveraged longs. That is calmer than a crash day. It also means there are still longs sitting just above the next levels, and a break lower could force some of them out. Our guide to funding rates and open interest explains how to read both.
Bitcoin Support Levels: Where Are the Floors Below $76,816?
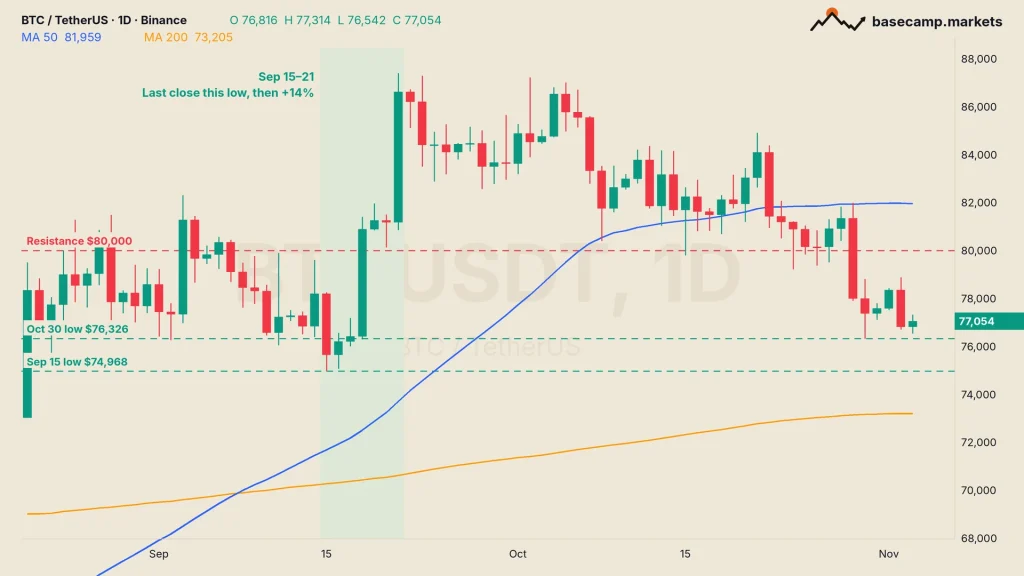
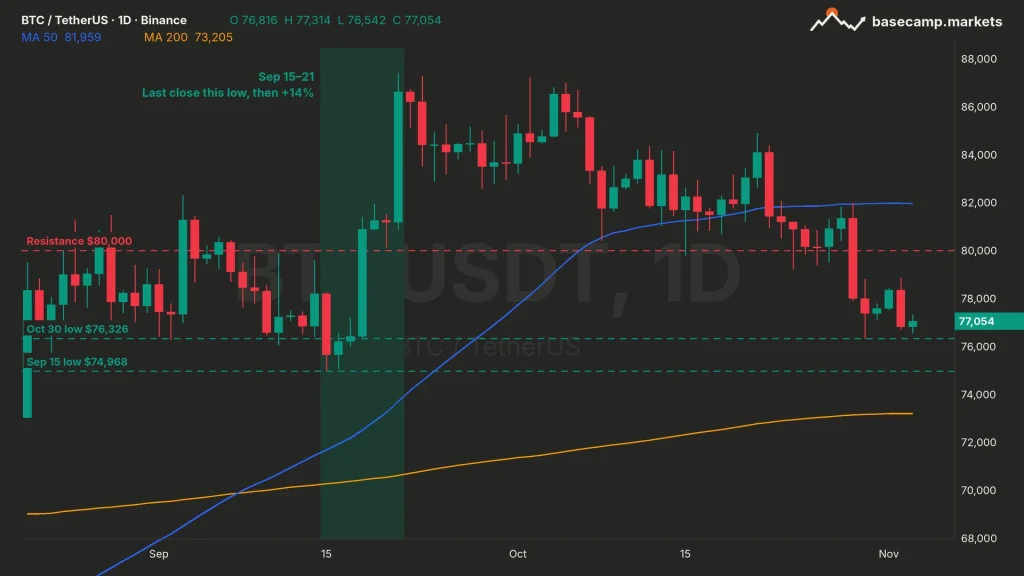
Bitcoin support levels are packed tight from here. The first floor is close: $76,326, the October 30 low, only about 1% under the price. From there down, five floors sit within $3,200 of each other:
- $76,326: the October 30 low, the bottom of the hack sell-off.
- $76,090: the 0.382 Fibonacci retracement of the move from $57,800 in July to $87,396 in September.
- $75,451: Strategy’s average cost for its 849,327 BTC, per its Monday filing. Bitcoin has closed above it every day since August 21.
- $74,968: the September 15 low, the floor of the last bounce.
- $73,205: the 200-day moving average, which Bitcoin reclaimed on August 19 and has not closed under since.
A daily close under $76,326 would put Bitcoin below everything it touched after the hack, inside the zone where September’s bounce started. A close under $74,968 would take out the low that started the 14% rally.
Above the price, $78,300 is the first test, then Monday’s open at $78,354 and its high of $78,878. Bitcoin needs a daily close back above $80,000 before the drop from October 29 looks like a dip rather than a new range. The 50-day average at $81,959 is the ceiling after that.
TRAIL MAP: Support and Resistance: How to Find Levels That Matter
What Could Move Bitcoin This Week?
Three things, in this order:
- Tuesday, November 3: the US midterm elections. The first polls close at 23:00 UTC (6:00 p.m. in Indiana and Kentucky), and the House and Senate results arrive through Wednesday.
- Monday’s ETF flows, due Tuesday: a second big outflow day after Friday’s $643.2 million would put real money behind the weak close.
- Friday, November 6: the US jobs report at 13:30 UTC (8:30 a.m. in New York), the last big number before the Fed’s December 8–9 meeting.
None of these needs to be dramatic. With Bitcoin 1% above its October low and funding still neutral, a soft US session was enough to make Monday’s close. The line that decides it is $76,326: as long as the Bitcoin daily close stays above it, a September-style bounce is still on the table.

TheCryptoMonk has been trading since 2017 and reads the market from the top down. The focus is macro and the high timeframes: where stocks, rates and liquidity are heading, and what the weekly and monthly charts say about Bitcoin. Short-term noise matters less than the bigger trend.
More from TheCryptoMonk