
The short version
- Bitcoin short squeeze: BTC jumped from $78,364 to $81,196 within two hours of the US stock market open on Wednesday, and about $320 million in shorts were liquidated in 30 minutes.
- The daily close of $80,504 is Bitcoin’s highest since October 28, the day before the Binance hack, as US stocks added about $1.2 trillion after Democrats won both houses of Congress.
- Next: the 50-day moving average at $82,155, with the US jobs report on Friday at 13:30 UTC (8:30 a.m. in New York) as the first test.
$320 million in short positions, gone in 30 minutes. That was the Bitcoin short squeeze on Wednesday, and it started when New York did. US stocks opened sharply higher at 14:30 UTC (9:30 a.m. in New York), the morning after Democrats won both houses of Congress, and BTC went from $78,364 to $81,196 in under two hours.
Eleven hours earlier, the same election result had pushed Bitcoin down to $75,736. Same news, opposite move. So what changed between the night and the open, and is Bitcoin 80K back for good this time?
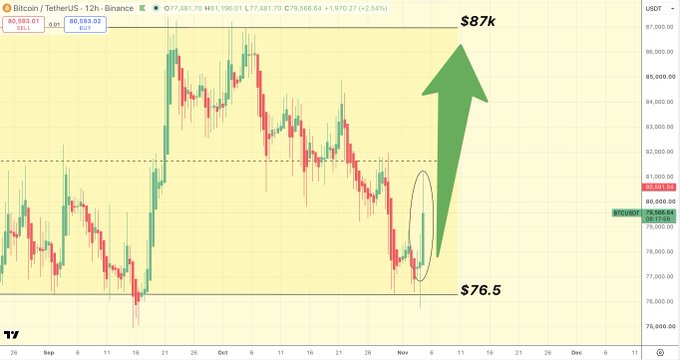
Satoshi Flipper of the Base Camp crew posted the 12-hour chart as the move landed:

$BTC/usdt 12 hour
BOOOOOOOM
the "I told you so's" are just getting tiresome at this point
How Big Was the Bitcoin Short Squeeze?
Very big for a single hour. CoinGlass data shared by Wu Blockchain shows $363.67 million in positions liquidated across crypto in the hour after the open, and $268.96 million of it was shorts. Bitcoin liquidations alone came to $192.26 million, 96.4% of them short positions. Over the full 24 hours, $933.18 million was liquidated from 120,141 traders.
A short squeeze feeds itself, and Wednesday showed every step of it:
- Traders who sold short into the overnight drop were betting on a lower price, most of them with borrowed money.
- When BTC rose instead, their losses ate through their margin, and exchanges closed the positions for them.
- Closing a short means buying. Each forced liquidation was a market buy order.
- Those buys pushed the price into the next group of short stops, and the chain kept going until it ran out of shorts near $81,200.
That is why the move looked so vertical. The 15:00 UTC hour alone traded $317 million in BTC on Binance spot, more than double any other hour that day.
Sponsored · Affiliate link
Save 20% on fees trading on WEEX
Base Camp may earn a commission if you sign up. It never affects what we write.
Why Did Stocks and Bitcoin Rally After the Midterms?
Because markets read a Democratic Congress as gridlock, and gridlock means fewer surprises. Overnight, Bitcoin was the only big market open, so it took the first hit. When stock traders got their turn, they bought, and crypto followed them up.
Here is the chain as the market priced it on Wednesday:
- Gridlock: President Trump keeps the White House and his veto, but from January 3 every new law needs a Democratic House and Senate. Fewer sudden policy moves from Washington, which markets tend to like. We covered the history in our midterm results piece.
- Oil: WTI crude futures fell 8.3% on Wednesday to $88.12 and are down 15% from last Friday’s $104.12. Cheaper energy takes some pressure off inflation.
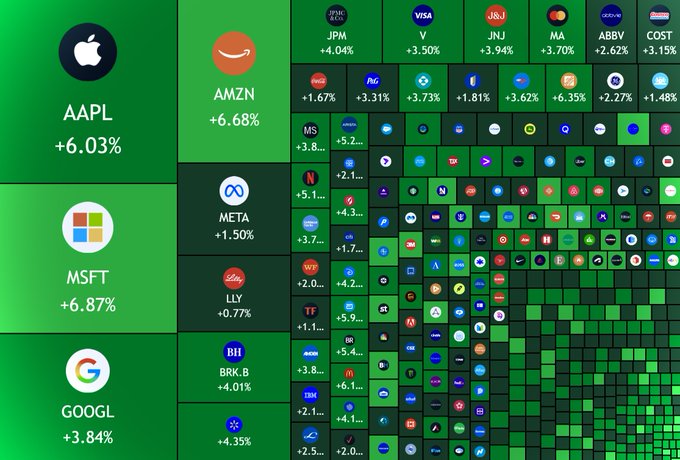
- Stocks: the Dow Jones jumped 3.0% to 53,356, about 1,570 points. The S&P 500 gained 1.6% and the Nasdaq 1.4%. Strategy (MSTR) closed 5.1% higher and Coinbase (COIN) 4.2%.
Add it all up and US stocks gained about $1.2 trillion in one session:

JUST IN: 🇺🇸 $1,200,000,000,000 added to the US stock market today.
One thing did not move the right way, and it is worth keeping in mind. Traders on Kalshi now price a December rate hike at 81%, up from 75% a day earlier. So this rally wasn’t about cheaper money. It was relief that two big unknowns, the election and the oil spike, got smaller at the same time.
SIDE TRAIL: Midterm Election Results: Democrats Sweep Congress, Bitcoin Dips First
Did Altcoins Follow Bitcoin?
They did, and Ethereum did better. ETH trades at $2,435 at the time of writing, up 8.4% in 24 hours, against 5.6% for Bitcoin. Solana is up 6.7% at $97. Ethereum also had $124.05 million liquidated in that one hour, the second-biggest pile after Bitcoin.
When altcoins rise faster than BTC on a squeeze day, it usually means traders were more bearish on them, so there were more shorts to burn. That says more about positioning than about new buyers. The Fear & Greed Index tells the same story: it jumped from 34 (Fear) to 50 (Neutral) in a single day.
Bitcoin Price Analysis: Is $80,000 Back for Good?
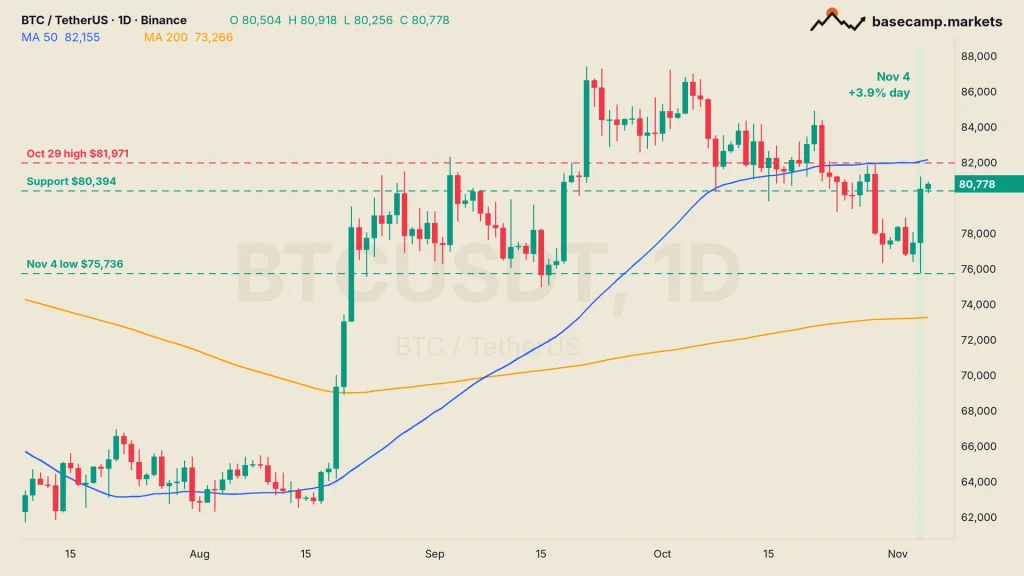
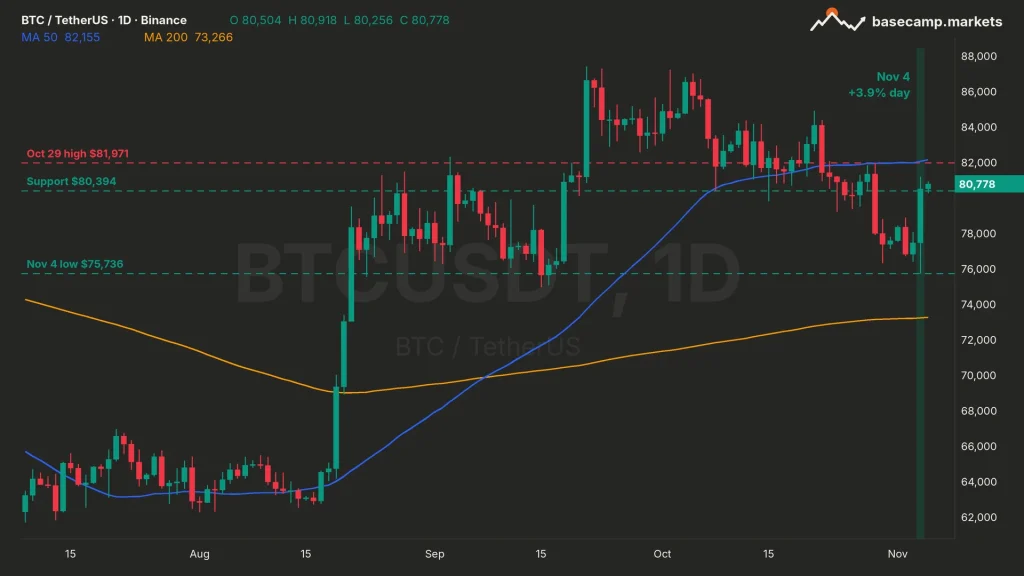
Not yet, but it is the best close in a week. Bitcoin finished Wednesday at $80,504 on Binance, up 3.9% on the day and its highest daily close since October 28 ($81,343), the day before the $6.3 billion Binance hack knocked it under $80,000. BTC trades at $80,780 at the time of writing, about 4% above its November open of $77,582.
That matters for the month. Bitcoin closed October 7.2% lower, its second red October in a row, and the November history after red Octobers split on one line: whether the October low of $76,326 held. Wednesday’s overnight wick poked about $600 below it, but the day closed nearly $4,200 above, so the warning sign, a daily close under the October low, never came.
The squeeze erased the election-night drop and most of the hack drop. It did not clear the ceiling above:
- $81,971: the October 29 high, where the hack sell-off started.
- $82,155: the 50-day moving average, which Bitcoin hasn’t closed above since October 21.
Below the price, the area to watch is $80,000 to $80,394. A pullback that holds there would turn the old ceiling into a floor. If it fails, the $75,736 low from election night is the next real level, with the 200-day moving average at $73,266 under it.
Two signs say this was a Bitcoin short squeeze rather than a rush of new longs. Funding on OKX’s BTC perpetual stayed at or below its normal 0.01% every eight hours through the whole move, so buyers aren’t paying up for leverage yet. And the shorts that fuelled Wednesday are mostly gone now. The next leg up needs buyers who choose to buy.
TRAIL MAP: Crypto Leverage Explained: Perps and Liquidation
The first test comes on Friday, when the US jobs report lands at 13:30 UTC (8:30 a.m. in New York).

Teddy has been trading crypto since 2016. The focus is altcoins and EMA setups: finding coins sitting on key levels, waiting for support to hold or a range to be reclaimed, and trading the move from there. Bitcoin sets the tone, but the opportunities are usually in the alts.
More from Teddy