
The short version
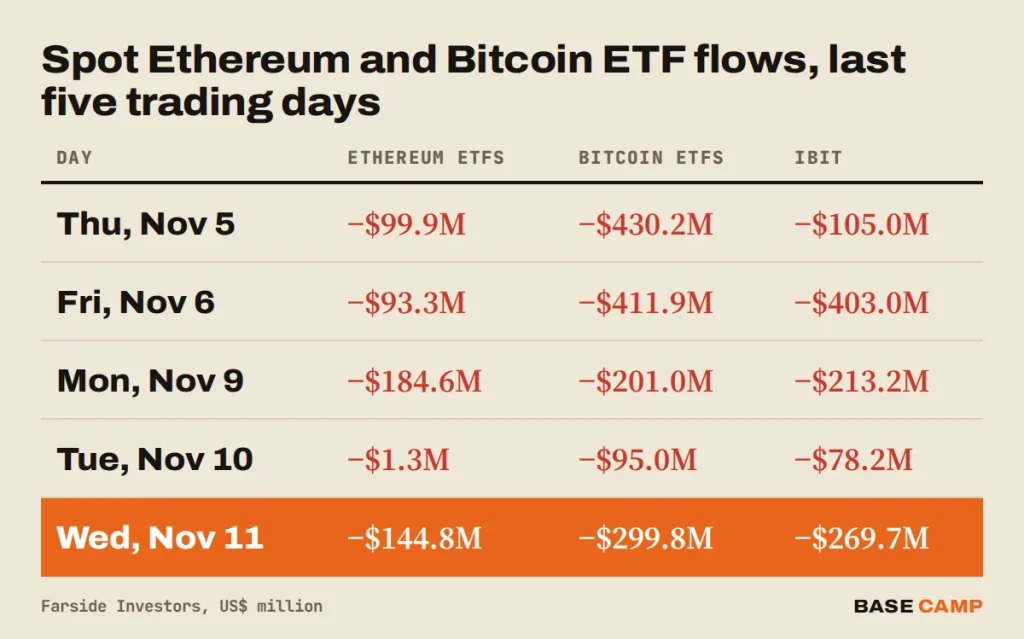
- Ethereum ETF outflows hit $144.8 million on November 11, with BlackRock’s ETHA losing $129.8 million, the funds’ fifth red session in a row.
- November is now about $695.9 million out for the Ethereum funds, already more than 40% of October’s $1.61 billion.
- Bitcoin ETFs lost $299.8 million, a fifth straight red day, as IBIT went red for a ninth session and about $2.0 billion since October 30.
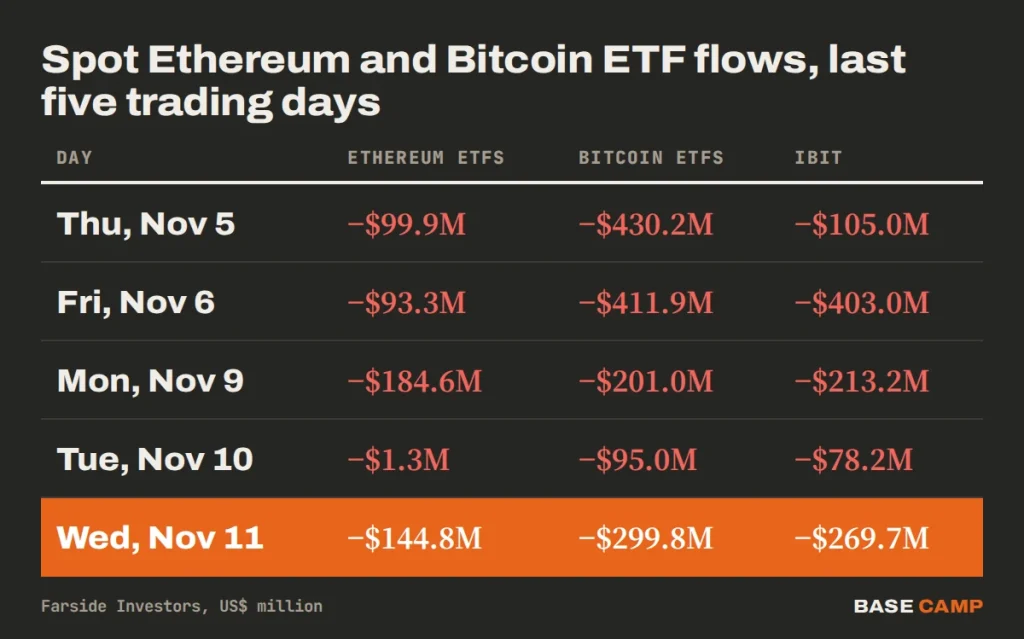
US spot Ethereum ETFs gave back another $144.8 million on Wednesday, November 11, and BlackRock’s ETHA was $129.8 million of it. That was their fifth losing session in a row, and the Bitcoin funds had no better day: they lost $299.8 million, also their fifth straight red print.
The Ethereum ETF outflows were spread thin outside BlackRock. Bitwise’s ETHW lost $4.8 million, Fidelity’s FETH $4.1 million and Franklin’s EZET $0.8 million, while six funds reported nothing at all. So is this a slow leak or the start of something bigger?
Farside’s Wednesday post lists every fund:

𝗘𝘁𝗵𝗲𝗿𝗲𝘂𝗺 𝗘𝗧𝗙 𝗙𝗹𝗼𝘄 (𝗨𝗦$ 𝗺𝗶𝗹𝗹𝗶𝗼𝗻) – 2026-11-11
TOTAL NET FLOW: -144.8
ETHA: -129.8
ETHB: -5.3
FETH: -4.1
ETHW: -4.8
TETH: 0
ETHV: 0
QETH: 0
EZET: -0.8
MSSE: 0
ETHE: 0
ETH: 0
ETHA Takes 90% of the Ethereum ETF Outflows
ETHA’s $129.8 million is 90% of the day’s total, and BlackRock’s second Ethereum fund, ETHB, added $5.3 million more. In other words, Wednesday was a BlackRock story, much like Monday, when ETHA lost $119.3 million of the $184.6 million. Two of the last three sessions, same seller.
ETHA outflows on that scale aren’t new, either. BlackRock’s fund lost $345.9 million in the first week of November alone, almost all of the group’s $365.2 million that week.
Wednesday was also the second-worst day of the month for the group, behind only Monday. The five red sessions since November 5 add up to $523.9 million, and November now stands at about $695.9 million out after eight trading days, per Farside. For context, October lost $1.61 billion, the worst month of 2026 for these funds, and the Ethereum ETF outflows in November are already past 40% of that.
Sponsored · Affiliate link
Save 20% on fees trading on WEEX
Base Camp may earn a commission if you sign up. It never affects what we write.
Are Bitcoin ETFs Holding Up Any Better?
No. Bitcoin ETF outflows reached $299.8 million on Wednesday, three times Tuesday’s $95.0 million and the biggest exit since last Friday. IBIT lost $269.7 million of it, its ninth red session in a row, which takes BlackRock’s Bitcoin fund to about $2.0 billion out since October 30.
Grayscale’s GBTC added $39.1 million, its first outflow since November 6. Morgan Stanley’s MSBT went the other way again with $9.0 million in, its third inflow in a row and the only green number on the board.
November is now $1.88 billion out for the Bitcoin funds, about 3.6 times the $515.9 million that left in all of October. Bitcoin trades at $73,495 at the time of writing, sitting on its 200-day average near $73,147.
SIDE TRAIL: Bitcoin ETF Outflows Slow to $95M, but IBIT Bleeds for an 8th Straight Session
Ethereum Price Sits Just Above $2,000
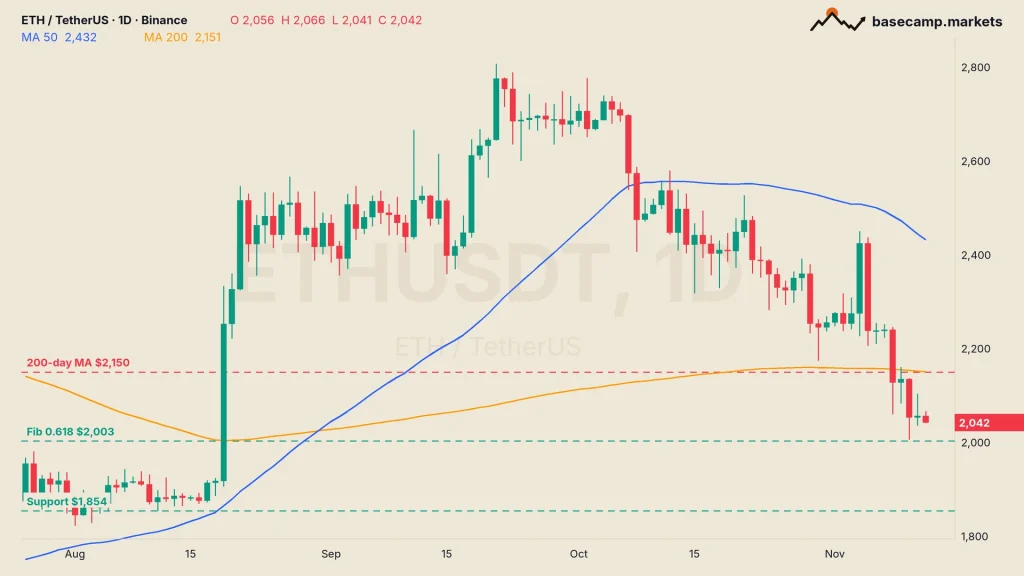
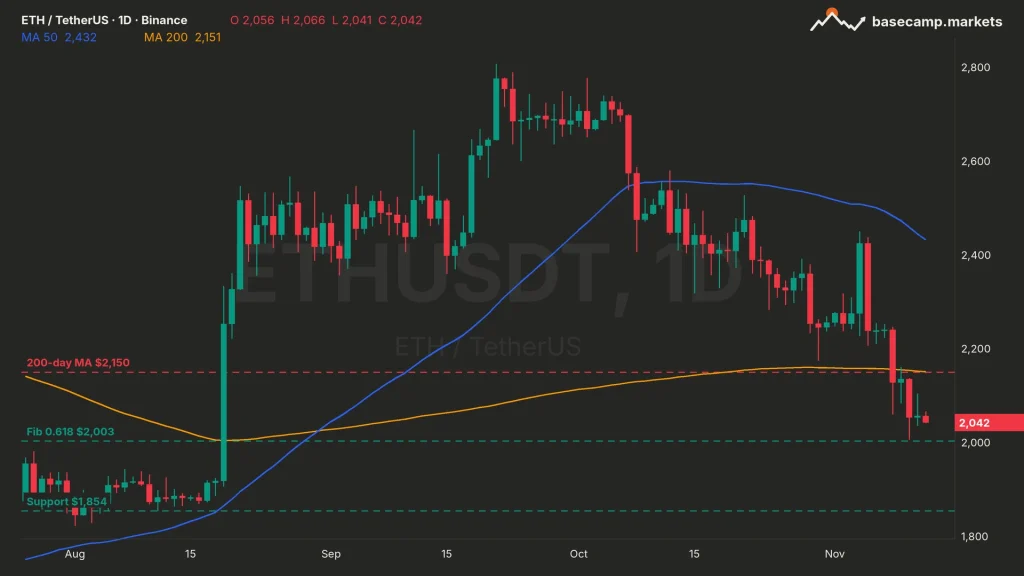
The ETH price is $2,042 at the time of writing, down about 16% in a week and below its 200-day moving average at $2,151, the average close of the last 200 days. It has closed under that line every day since Sunday. Four closes, no reclaim.
- Resistance: the 200-day MA at $2,151, then the 50-day near $2,432.
- Support: $2,003, the 0.618 Fibonacci retracement of the June to September rally, which Tuesday’s wick tested at $2,006. Below it, an August swing low at $1,854.
A daily close back above $2,151 would undo the breakdown. Until then, the funds and the chart point the same way, which isn’t ideal if you were hoping one of them would disagree.
TRAIL MAP: Bitcoin ETF Outflows Hit $201M as IBIT Goes Red for a 7th Day
The Fear & Greed index reads 28, one point lower than on Wednesday.

TANG has been trading crypto since 2017. The focus is technicals, DeFi and onchain data. On the chart, that means high-timeframe support, moving averages and momentum divergences. Onchain, it means regular checkups on where the data puts the cycle. TANG once ran CryptoJungle, a free community for researching and trading together, and brings that same spirit to Base Camp as one of its co-founders.
More from TANG