
The short version
- Why is crypto down? CZ named five possible reasons after Bitcoin hit $62,006 on Sunday: the Anthropic IPO, ETF outflows, hacks, hot inflation and the midterms.
- The data backs two: spot Bitcoin ETFs lost $1.9 billion in seven sessions, and the 2-year Treasury yield jumped from 4.51% to 4.88% as December hike odds hit 88%.
- The midterms don’t fit: Bitcoin rose 3.9% on results day, and the October 30 Binance hack came before a rally above $80,000.
- Next: Anthropic prices its roughly $61 billion IPO this week, and the FOMC minutes land on Wednesday at 19:00 UTC.
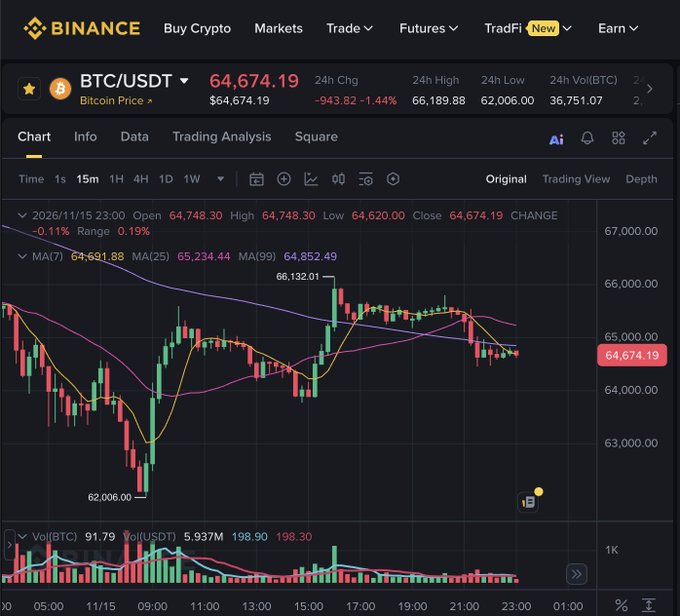
“No one knows for sure.” That’s how Binance co-founder CZ started his answer on Sunday, a few hours after Bitcoin hit $62,006 on Binance, its lowest price since July.
Then he gave five possible reasons anyway. Money moving to the Anthropic IPO. ETF outflows. Security fears. Hot US inflation. Political risk after the midterms. He added that Binance did not sell, and that he bought.
It’s the most shared answer to the question everyone is typing: why is crypto down? BTC trades at $64,900 at the time of writing, ETH at $1,820.72. So which of the five reasons hold up against the numbers, and which don’t?
Here is the post, 1.7 million views and counting:

Why are crypto prices down?
No one knows for sure. Correlation does not prove causation. Here are some potential reasons.
Money shifting to the Anthropic IPO: x.com/ColeMacro/stat…
ETF outflows: U.S. spot Bitcoin ETFs saw about $1.9 billion in outflows over seven trading
Why Is Crypto Down? CZ’s Five Reasons at a Glance
Two fit the data and the timing. One partly fits. Two don’t.
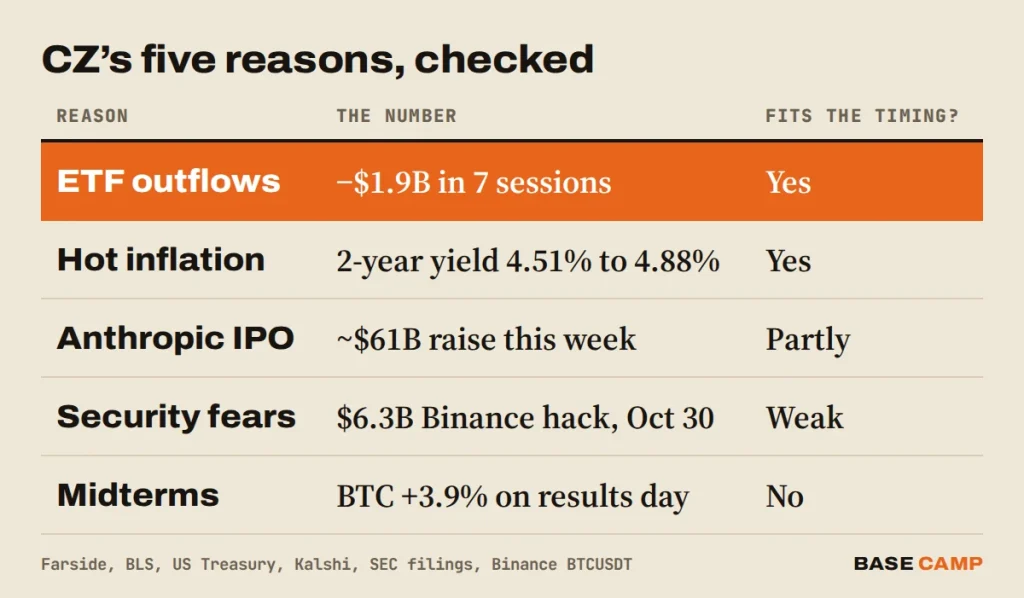
The order matters. Why is Bitcoin down this month? The answer starts on November 5, when the selling began. Anything that happened before that, and didn’t stop Bitcoin from rallying, is a weak suspect.
Sponsored · Affiliate link
Save 20% on fees trading on WEEX
Base Camp may earn a commission if you sign up. It never affects what we write.
Did ETF Outflows Drive the Drop?
Yes, and this one is on the record. Bitcoin ETF outflows came to $1,907.4 million over the seven sessions from November 5 to 13, per Farside’s data. CZ’s “about $1.9 billion” is right.
Not one green day in that stretch. BlackRock’s IBIT did most of it again on Friday, the last session before the weekend crash:

𝗕𝗶𝘁𝗰𝗼𝗶𝗻 𝗘𝗧𝗙 𝗙𝗹𝗼𝘄 (𝗨𝗦$ 𝗺𝗶𝗹𝗹𝗶𝗼𝗻) – 2026-11-13
TOTAL NET FLOW: -185.4
IBIT: -143.5
FBTC: -41.9
BITB: 0
ARKB: 0
BTCO: 0
EZBC: 0
BRRR: 0
HODL: 0
BTCW: 0
MSBT: 0
GBTC: 0
BTC: 0
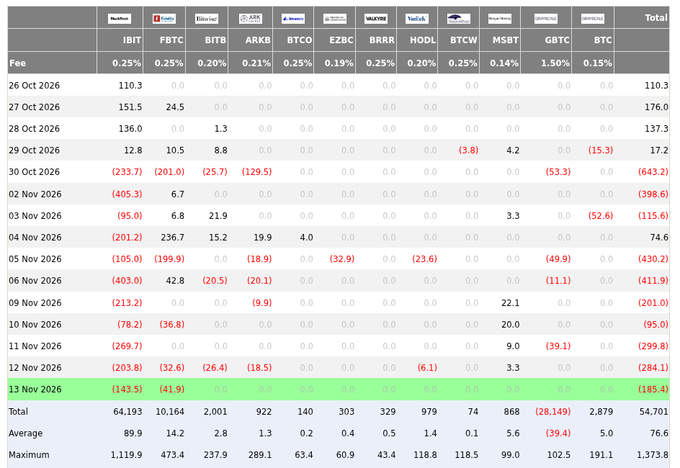
The chain is simple. Holders redeem, issuers sell Bitcoin to pay them, and the price drops a bit further. Bitcoin closed November 4 at $80,504. It closed November 13 at $68,314. Same seven sessions.
Ethereum funds bled too, as CZ said. They are on a seven-week losing run.
Hot Inflation: The Reason Behind the Reason?
Probably. October consumer prices rose 0.4%, a tenth above forecast, with core up 0.3% for a third month. Producer prices on Friday came in at 0.3%, a touch under the 0.4% expected, but the BLS core measure that strips out food, energy and trade services rose 0.5%. Over 12 months, producer prices are up 6.5%.
Bond traders took it badly. The 2-year Treasury yield, the one that tracks Fed expectations closest, went from 4.51% on November 6 to 4.88% on November 13, in the Treasury’s daily data. The 10-year closed at 5.15%.
On Kalshi, a quarter-point hike at the December 8–9 meeting trades at 87% to 88%. A bigger move is at 8% to 9%. A hold, 3% to 4%.
Higher yields make an asset that pays nothing, like Bitcoin, harder to hold. It’s also a good guess at why ETF holders kept selling. The two reasons are really one.
SIDE TRAIL: Bitcoin Crash Today: BTC Hits a Four-Month Low at $62,006, Then Bounces to $65K
Is the Anthropic IPO Pulling Money Out of Crypto?
Maybe, but nobody can prove it. Anthropic’s latest amended filing, from November 10, sets the terms: 825 million shares at $70 to $78 each, about $61 billion at the midpoint, plus a $26 billion private placement at the same price, Renaissance Capital reported. It is expected to price and trade this week on Nasdaq as ANT.
CZ linked a chart from Strive’s Matt Cole, who lined up Bitcoin’s fall into the SpaceX listing in June with today’s:

Bitcoin fell 19% into the biggest IPO ever. Now it's down 18% heading into the second biggest.
SpaceX raised $75B when it went public on June 12. In the 50 days before it listed, Bitcoin dropped 19%. Anthropic plans to raise up to $64B when it lists next week, and Bitcoin is
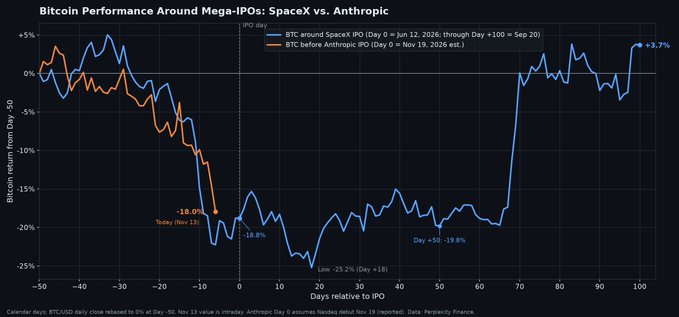
“Bitcoin fell 19% into the biggest IPO ever. Now it’s down 18% heading into the second biggest,” Cole wrote. Last time, Bitcoin bottomed at $57,800 on July 1, 19 days after SpaceX listed.
It’s a neat overlay. It’s also two data points. Funds selling Bitcoin to make room for ANT would look exactly like the ETF outflows above, and so would funds selling for any other reason. Flows don’t come with names attached.
Security Fears: Real, but Mostly Old News
The scares are real. The timing is weak.
The Binance hack drained $6.3 billion on October 30. Bitcoin still closed November 4 above $80,000. If the hack scared money out, it took its time.
The iPhone story is newer. The DarkSword iOS exploit went around crypto X from November 9, after a user said his Exodus and Phantom wallets were drained. The fix had been out for months. Google also patched a Chrome flaw on November 9 that was already used in attacks, its eighth this year.
Do these make people keep less money on exchanges and hot wallets? Probably, at the edges. Do they explain a $18,500 drop in eleven days? No.
Did the Midterms Cause the Sell-Off?
No. The timing runs the wrong way.
Democrats swept Congress in the November 3 vote. On November 4, results day, Bitcoin rose 3.9% and closed at $80,504, its best close of the month. The slide began the day after, when the Nasdaq 100 fell 6.4%.
The policy worry isn’t empty. A Democratic Congress means the next crypto market structure bill gets written by Maxine Waters and Elizabeth Warren. But that’s a 2027 story, and the market shrugged at it on the night.
As for “Binance did not sell”: there is no public feed of Binance’s own trading, so that one rests on CZ’s word. Binance Research did post a related number on Saturday. From November 11 to 14, net aggressive selling came to 2,707 BTC on Binance against 7,438 BTC on an unnamed “major USD spot venue.” That’s the exchange’s own data, and it measures its customers, not the company.
Bitcoin Price Analysis: Where Is the Floor?
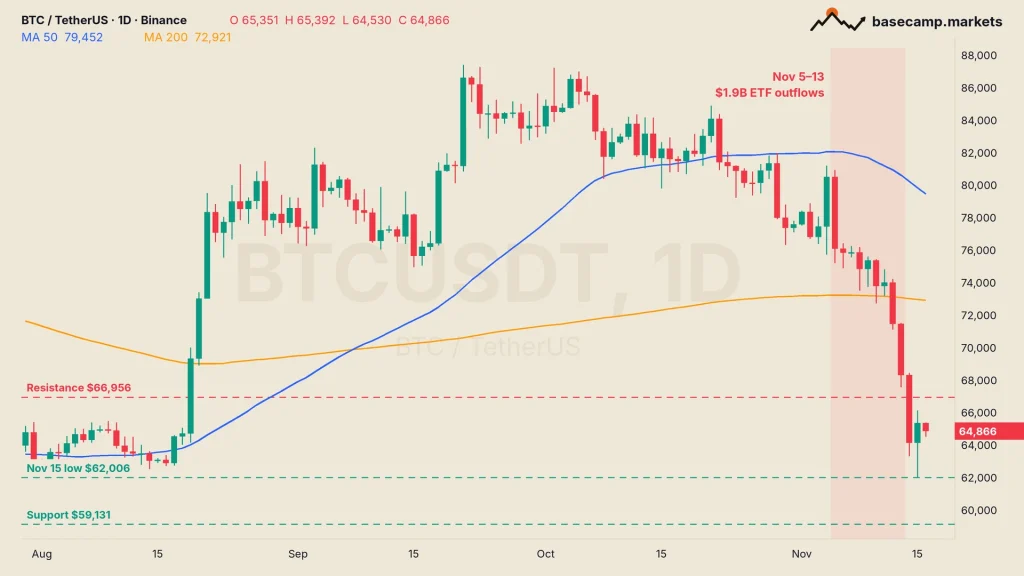
The floor is Sunday’s low at $62,006. Below it, the chart has nothing until $59,131.
Zoom out first. Last week opened at $74,851 and closed at $65,351, a loss of 12.7% and a sixth red week in a row. Both moving averages sit far above price: the 200-day at $72,921, the 50-day at $79,452 and still pointing down.
- The ceiling: $66,956, the July 21 high, and the first test of any bounce.
- The floor: $62,006, the wick that ended the weekend.
- Below that: $59,131, then the July 1 low at $57,800, Cole’s SpaceX bottom.
The Fear & Greed Index reads 10. Extreme fear, two days running.
So why is crypto down? Mostly money leaving the funds while rates head higher. The rest is noise around it.
Two of CZ’s reasons are back on the calendar this week. Anthropic prices its shares, and the FOMC minutes land on Wednesday at 19:00 UTC (2:00 p.m. in Washington).

TheCryptoMonk has been trading since 2017 and reads the market from the top down. The focus is macro and the high timeframes: where stocks, rates and liquidity are heading, and what the weekly and monthly charts say about Bitcoin. Short-term noise matters less than the bigger trend.
More from TheCryptoMonk