The short version
- Ethereum price trades at $2,328, down about 14% in 30 days, after Sunday’s $2,330 close, its lowest daily close since August 20.
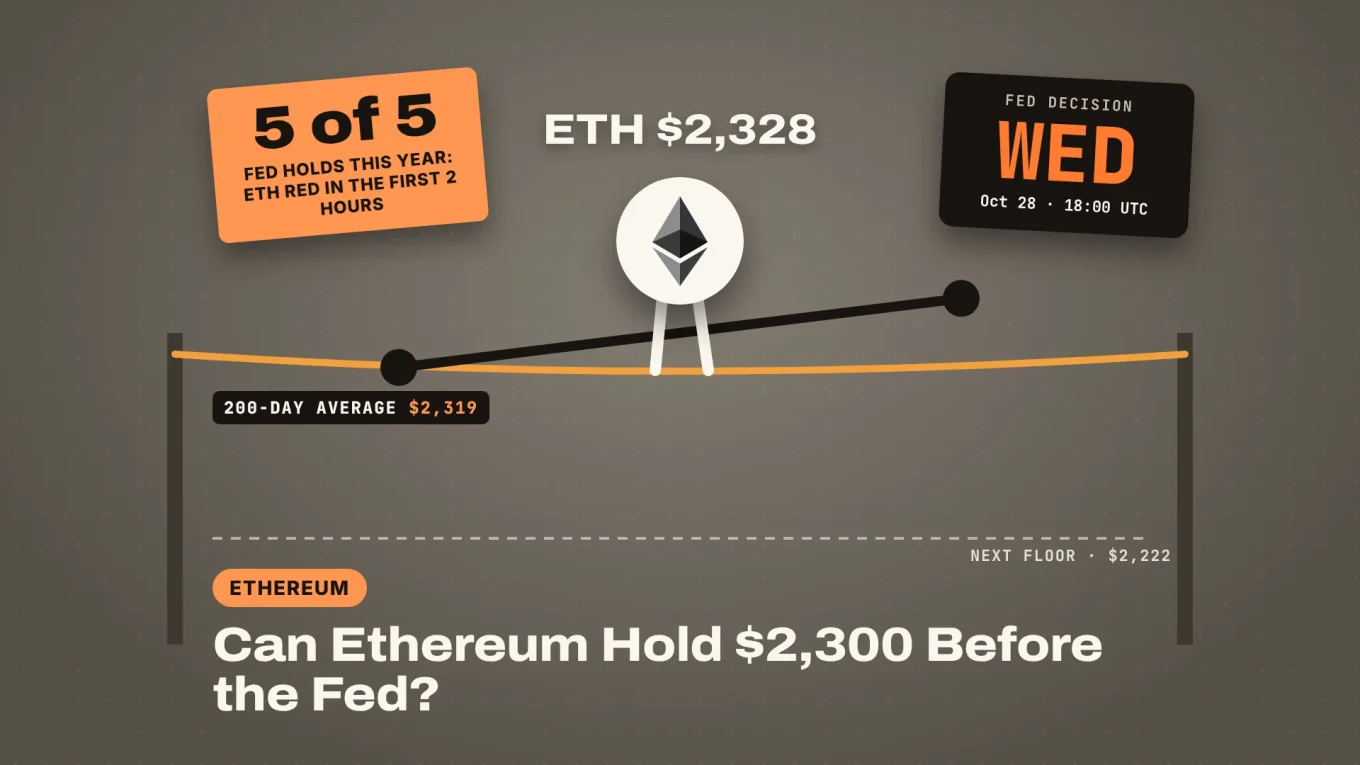
- ETH sits right on its 200-day average at $2,319 two days before the Fed decision on Wednesday at 18:00 UTC (2:00 p.m. in Washington), and it fell in the first two hours of all five Fed holds this year.
- The crew is watching $2,282, Saturday’s low, as the floor and $2,418 as the first ceiling, with Kalshi pricing a hold at 93%.
The Ethereum price is parked on the one level the whole chart agrees on. ETH trades at $2,328 on Binance at the time of writing, down about 14% in 30 days from $2,689, and it closed Sunday at $2,330, its lowest daily close since August 20.
That puts ETH right on its 200-day moving average, with the Fed decision on Wednesday at 18:00 UTC (2:00 p.m. in Washington). Ethereum has fallen on four of this year’s five Fed holds. So does $2,300 survive the week?
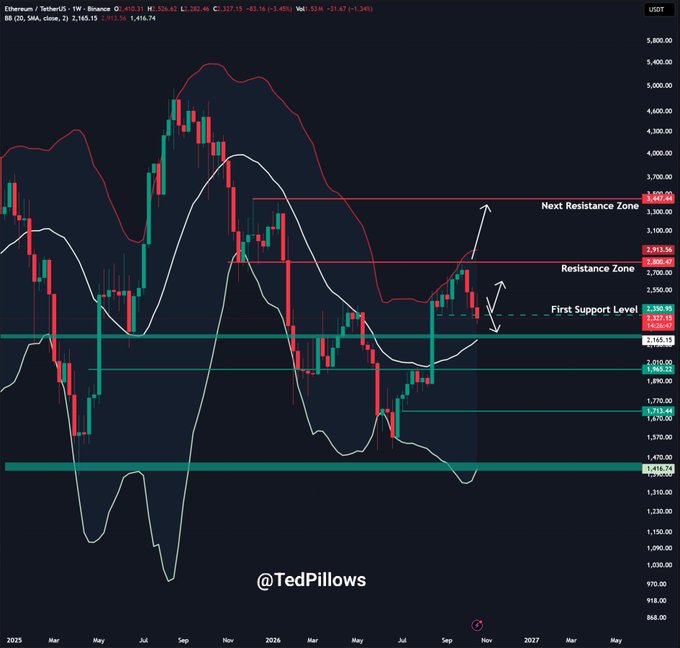
Ted Pillows summed up the mood on Sunday:

$ETH spot buyers are absent.
IMO, Ethereum will find strong buyers around the $2,200 level and then a reversal above $3,000.
Why Is the Ethereum Price Falling?
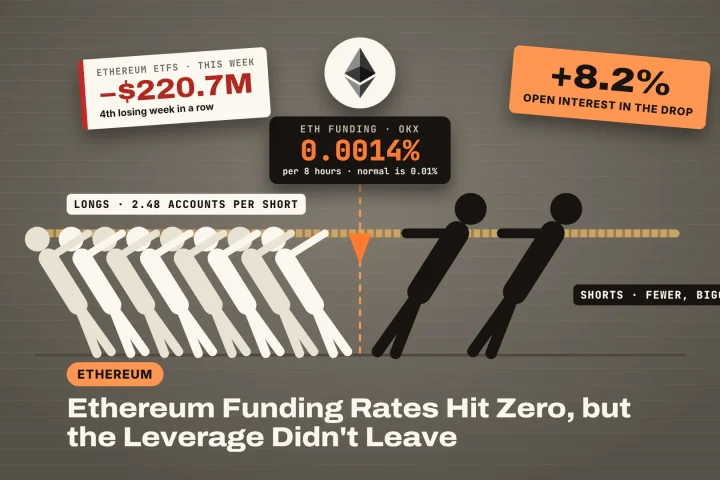
Because the spot buyers left and the funds kept selling. US spot Ethereum ETFs lost $220.7 million last week, per Farside, their fourth losing week in a row. That is $1.22 billion out over four weeks, most of it in October.
ETH has also lost ground to Bitcoin. The ETH/BTC ratio closed Sunday at 0.0291 and trades at 0.0290 now, the lowest since July 23. When Ethereum falls faster than Bitcoin in a weak market, it is the coin traders are cutting first.
The slide has been a staircase. ETH topped at $2,807 on September 21, lost $2,600 on October 7 and has not closed above the 50-day average since October 12. Saturday’s wick to $2,282 was the lowest price in two months.
Sponsored · Affiliate link
Save 20% on fees trading on WEEX
Base Camp may earn a commission if you sign up. It never affects what we write.
Why $2,300 Matters for ETH
Three lines meet there. The 200-day exponential moving average, the long trend line that weights recent prices more heavily, sits at $2,319, less than 0.5% under the price. The 0.382 Fibonacci retracement of the rally from the June low at $1,506 to the September high is $2,310. And $2,318 is the October 15 low that held the first time.
Saturday tested all three. The ETH price dipped to $2,282 for a few hours, then closed back at $2,359. Sunday’s close at $2,330 kept it above the 200-day line, but only by $11.
Losing that line would change the trend. ETH has closed above its 200-day EMA every day since the jump on August 19 and 20, when it ran from $1,906 to $2,327 in two sessions. That jump left little trading behind it, so there is not much support between $2,282 and $2,222.
DISCOVER: Indicators Worth Knowing: Moving Averages, RSI and Volume
How Has Ethereum Traded on Fed Days This Year?
Badly, and worse than Bitcoin. We took ETHUSDT on Binance from the Fed statement (18:00 UTC, 19:00 UTC in January before US clocks changed) to two hours later, which covers the press conference, and to 24 hours later:
| Fed meeting | Decision | ETH at the statement | 2 hours later | 24 hours later |
|---|---|---|---|---|
| January 28 | Hold | $3,016 | −0.1% | −8.3% |
| March 18 | Hold | $2,204 | −0.8% | −3.5% |
| April 29 | Hold | $2,283 | −2.2% | −1.1% |
| June 17 | Hold | $1,789 | −3.0% | −6.1% |
| July 29 | Hold | $1,916 | −1.4% | +0.2% |
| September 16 | Hike to 3.75–4.00% | $2,391 | +0.7% | +3.0% |
Five holds, five red first hours, with an average drop of 1.5%. Four of the five were still lower a day later. In four of them ETH also fell more than Bitcoin over the same two hours. The only green Fed day was the September hike, when the move was already priced and the uncertainty was gone.
Wednesday looks like a hold. Traders on Kalshi price no change at 93% and a December hike at 80%. A hold with December still open is the setup that has hurt ETH most this year, because it leaves the hike hanging over the market for six more weeks.
EXPLORE: Risk Management: The 1% Rule and Position Sizing That Keeps You in the Game
Ethereum Price Analysis: Can ETH Hold $2,300 Before the Fed?
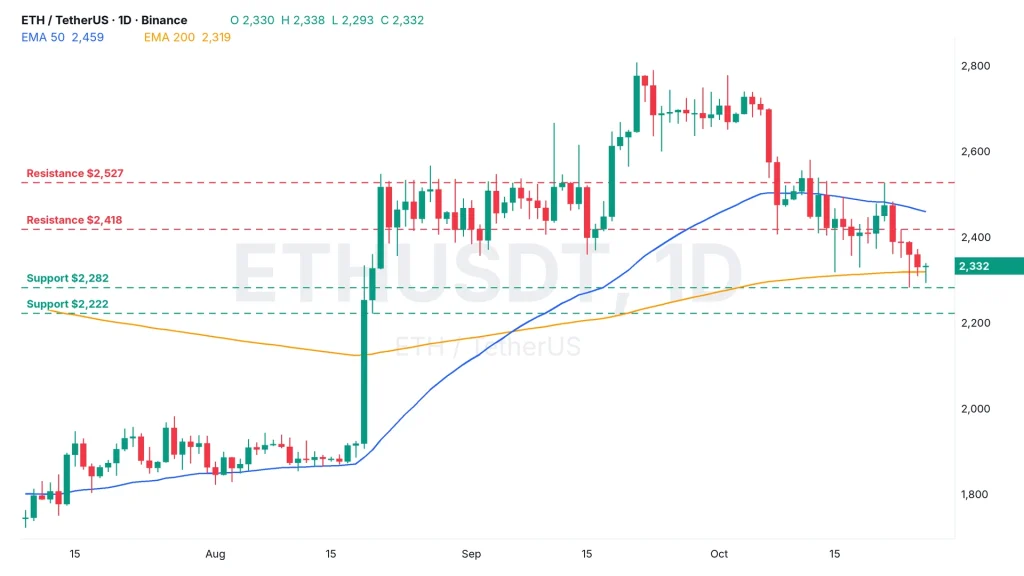
Into Wednesday, probably, because the dip buyers have defended it twice this month. After the statement is the harder question. The Ethereum price sits at $2,328, just above the 200-day EMA at $2,319 and well under the 50-day EMA at $2,459, which has been a ceiling since October 12.
The first resistance is $2,418, Friday’s high, where the last bounce stopped. Above that, $2,527 is the October 21 high. The Fear & Greed Index reads 50, neutral.
- Bull case: ETH holds $2,300 through the press conference and closes above $2,418, which opens the 50-day EMA at $2,459 and then $2,527.
- Base case: a range between $2,282 and $2,418 into Wednesday, with a dip in the first hours after the statement that buyers fade by Thursday.
- Bear case: a daily close under $2,282 breaks the 200-day line for the first time since August. Next is $2,222, the August 20 low, and below that the gap down to $1,906 where the August jump started.
$2,300 has held because buyers keep showing up there, not because the trend is with them. If the Fed leaves December hanging, Ethereum needs those buyers one more time.

In crypto since 2016. Trades the macro picture and reads the market on the high timeframes.
More from TheCryptoMonk →