The short version
- Bitcoin liquidation levels sit close on both sides of $76,000: CoinGlass’s Binance heatmap shows about $425 million in shorts at $76,300 to $77,600 and $200 million in longs at $74,700 to $75,300.
- Hyperliquid whales lean short, $1.36 billion against $1.05 billion in longs, and only $8 million of their longs break above $75,000.
- Last week’s piles both got hit: two of the three 40x whale longs left on their own, and the biggest short pushed its liquidation price out to $92,454.
- Next: the weekly close at 00:00 UTC on Monday and whether BTC holds Friday’s low of $74,888. Follow Base Camp on X for the levels as they move.
A new pile of leveraged Bitcoin shorts, worth about $425 million, has formed just above the price on Saturday. CoinGlass data shows a climb of about 2% would force them shut, the closest of this week’s Bitcoin liquidation levels.
Bitcoin trades at $75,900 at the time of writing, down about 2% on the week after a round trip from $81,196 on Wednesday to $74,888 on Friday. The longs below have thinned out after that drop. So which side is easier to reach now, and what has to happen first?
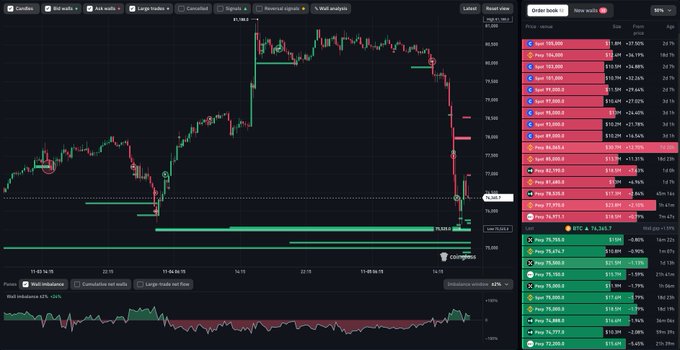
CoinGlass pointed at the same floor on Thursday, before the price tested it:

Where Are the Bitcoin Liquidation Levels This Week?
The shorts are closer and bigger. CoinGlass’s Bitcoin liquidation heatmap for Binance’s BTC-USDT perpetual shows a band of about $288 million between $76,300 and $76,900, with the strongest single level at $76,645. A second band of about $136 million follows at $77,000 to $77,600.
Below the price, the main band runs from $74,700 to $75,300 and holds about $200 million. Its strongest level is $75,135. Another $122 million sits lower at $74,300 to $74,600.
Here is how that works, step by step:
- A liquidation heatmap marks prices where many leveraged traders hit their liquidation price.
- When price reaches a band, the exchange closes those positions with market orders.
- Shorts get closed by buying, longs by selling, so each band pushes price toward the next one.
That is why a small move into a big band can turn into a fast one.
Sponsored · Affiliate link
Save 20% on fees trading on WEEX
Base Camp may earn a commission if you sign up. It never affects what we write.
What Do the Hyperliquid Whale Positions Show?
Hyperliquid whales lean short, and their longs sit much lower than last week. Hyperliquid, the onchain perp exchange, shows every open position. CoinGlass tracks 333 Bitcoin positions of $1 million or more there, worth $2.42 billion: $1.36 billion in shorts against $1.05 billion in longs.
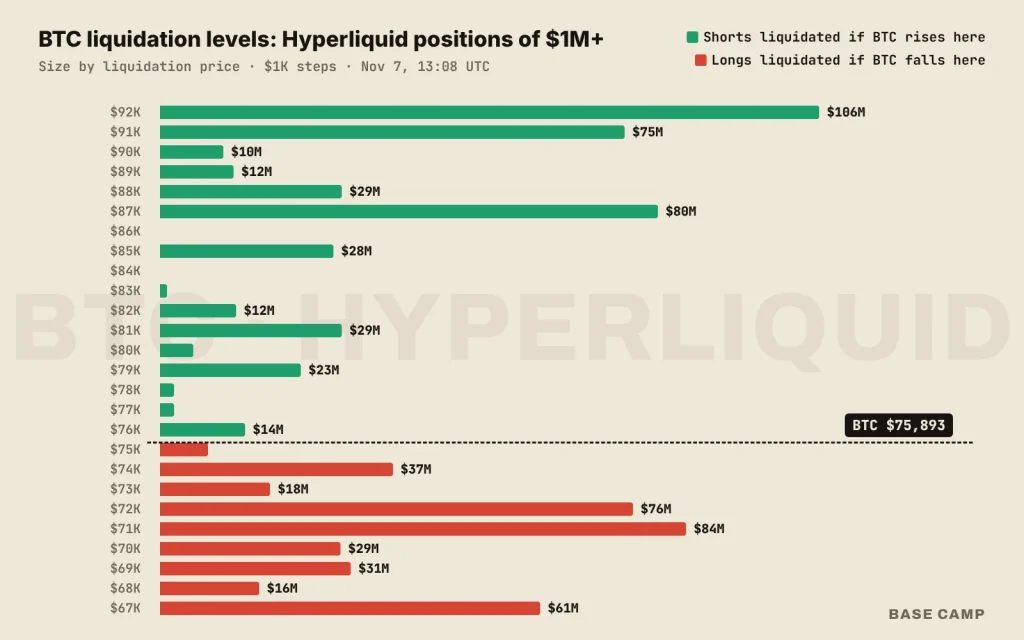
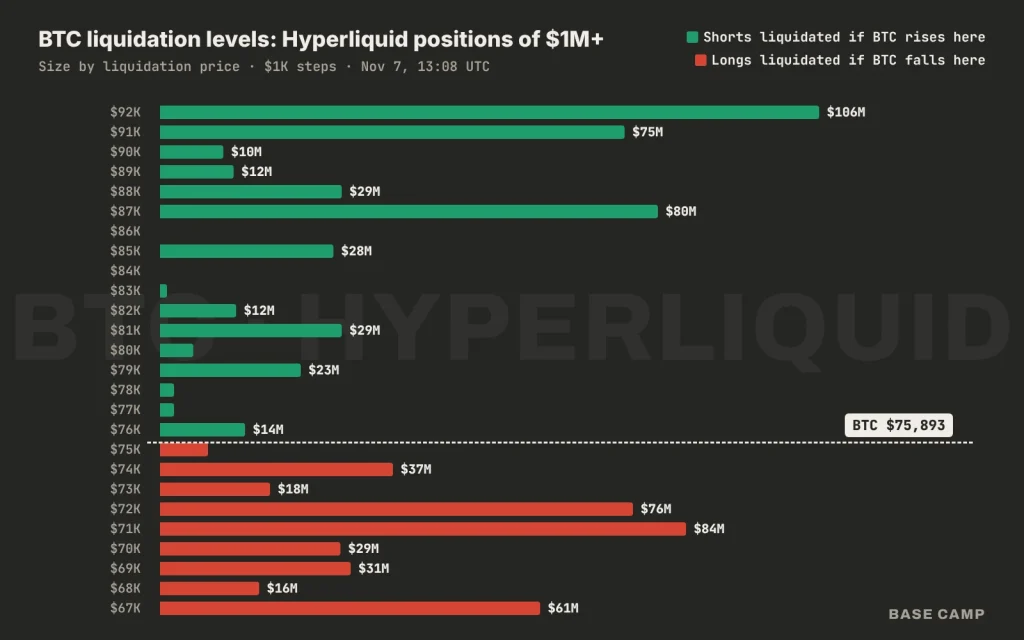
Sorted by liquidation price, the Bitcoin liquidation map reads like this:
- Longs: only $8 million breaks by $75,000, then $45 million by $74,000 and $139 million by $72,000.
- Shorts: $14 million by $77,000, $41 million by $80,000 and $196 million by $88,000.
The nearest whale short is tight. Wallet 0x6c2c holds a 148 BTC short worth $11.2 million at 40x, opened at $75,778, and breaks at $76,747.
The big one moved further away. Wallet 0xfc27 is now short 1,352 BTC, worth $102.6 million, at 25x. Its liquidation price rose from $87,441 last week to $92,454, and it sits on a $3.7 million profit. Wednesday’s spike to $81,196 never came close.
What Changed Since Last Week?
Both piles got hit. Last Saturday the Binance longs sat at $75,900 to $76,300 and the shorts at $78,200 to $78,800. Wednesday’s rally ran through the shorts, and Thursday’s sell-off ran through the longs on the way to Friday’s low.
The Base Camp team caught the day the rally broke:

Crypto's post-election rally lasted just one day
• Nasdaq 100 plunged 6.4%, its worst day since March 2020
• BTC fell 5.5%, ETH 7.7%
• $1.24B in crypto positions liquidated
• AI spending fears triggered the selloff
basecamp.markets/crypto-crash-n…
The three 40x whale longs from last week each went a different way:
- 0x4b62 took a small profit on its 222.9 BTC at about $77,586 on Saturday night, traded in and out on Sunday, and holds no Bitcoin position now.
- 0x2a8a sold its 235.4 BTC at about $75,817 early on Wednesday for a $219,000 loss, flipped short and lost another $105,000.
- 0x95fe is still long 201 BTC with no Bitcoin trade since. More margin sits behind it, so its liquidation price slid from $75,896 to $74,046.
Wider out, 18 whale longs worth $91.6 million had liquidation prices above Friday’s low last week. Only four of them are still open.
The wallet flagged on October 19 hasn’t moved. 0x6046 still holds 671.1 BTC at 12x, about $4 million under water, with a liquidation price of $67,192.
How Big a Move Would Trigger Them?
About 0.5% for the Binance shorts, about 1% for the Binance longs. Measured from $75,900:
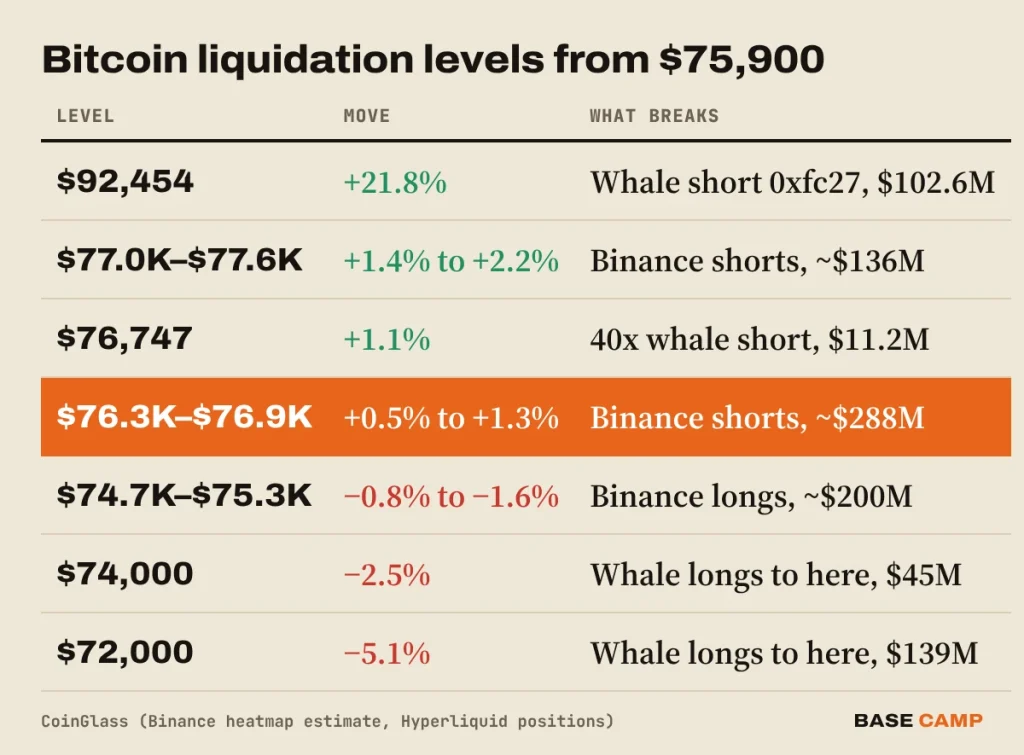
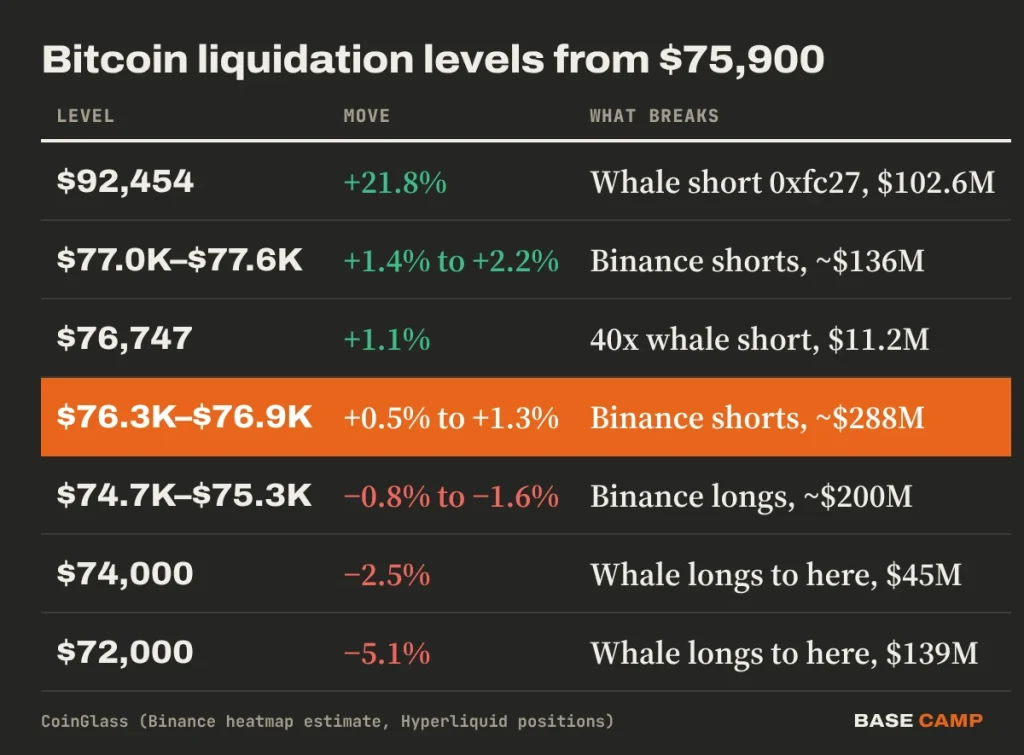
The whales point the other way from Binance. A 3% drop would clear about $48 million in Hyperliquid longs, a 3% rally only $16 million in shorts.
Are Traders Still Paying to Be Long?
Barely. The funding rate on Binance’s Bitcoin perpetual slipped just below zero, from the 0.01% baseline last week, while Bybit and OKX pay about 0.005% per eight hours. Hyperliquid still pays the 0.01% baseline once its hourly rate is scaled to eight hours.
The account count tells a different story. On OKX, 2.96 accounts are long BTC for every one short, up from 2.76 last Saturday, and on Binance the ratio rose from 2.67 to 3.04. So more small accounts are long, but they are paying almost nothing to stay there.
Open interest, the value of all open futures, fell 3.3% over the week while the price fell about 2%. CoinGlass counts $51 million in Bitcoin liquidations over the past 24 hours, $41 million of them longs, a quiet day after Thursday’s flush.
SIDE TRAIL: Funding Rates and Open Interest: Reading the Crowd
Can You Trust a Liquidation Heatmap?
Use it as a pressure map, not a list of orders. Binance doesn’t publish where its traders get liquidated, so CoinGlass estimates it from open interest, price history and common leverage. The Hyperliquid positions are real, but last week showed how fast they change: two of the three 40x longs left on their own, one with a profit and one with a loss.
TRAIL MAP: Futures and Leverage: How Liquidation Really Works
Bitcoin Price Analysis: Which Side Is Closer?
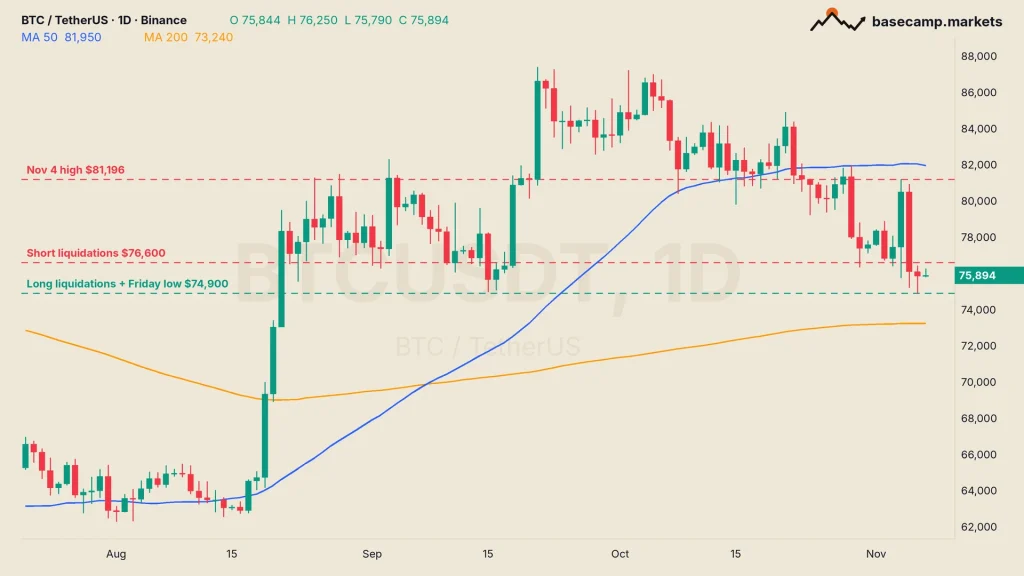
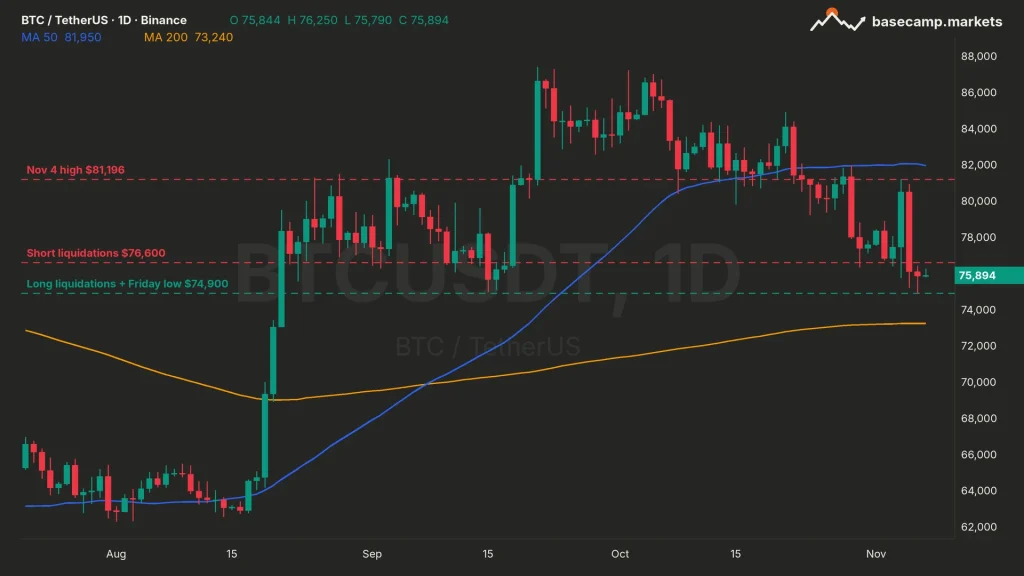
The shorts, by a few hundred dollars. BTC sits just under the $76,300 to $76,900 band, with Friday’s low of $74,888 and the long band right beneath it. The 50-day moving average is far above at $81,950, and the 200-day sits at $73,240.
The area to watch above is $76,600, if price can hold over it. A clean move through that band could pull BTC toward $77,600, where the second band ends.
Below, the condition is a daily close under $74,888. That would open the $200 million long band and the $74,000 whale longs, with the 200-day average next.
Last week, both sides got hit inside five days. The weekly candle closes at 00:00 UTC on Monday, 7 p.m. Sunday in New York.

Teddy has been trading crypto since 2016. The focus is altcoins and EMA setups: finding coins sitting on key levels, waiting for support to hold or a range to be reclaimed, and trading the move from there. Bitcoin sets the tone, but the opportunities are usually in the alts.
More from Teddy